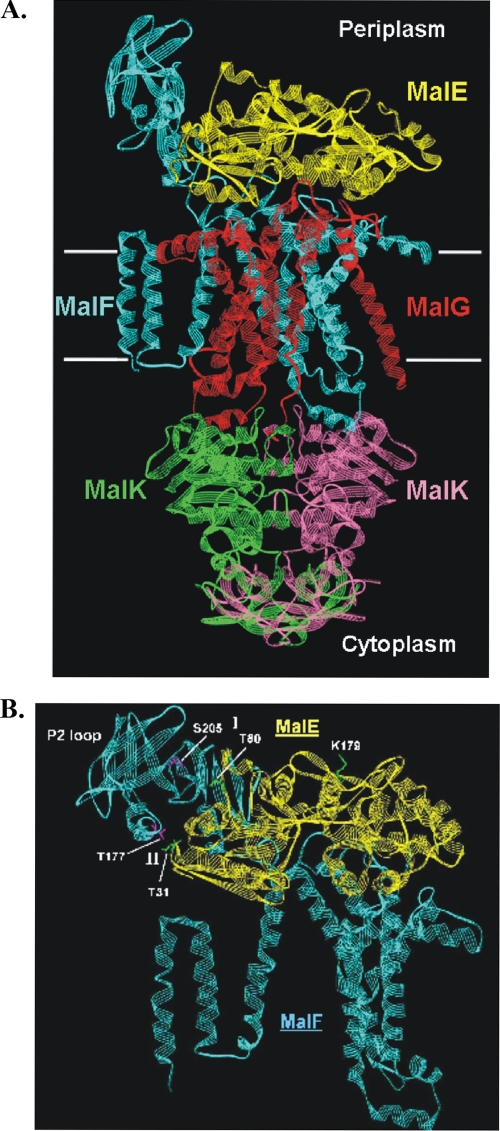
FIG. 1.
(A) Structure of the catalytic intermediate of the maltose transporter [MalFGK(E159Q)2-E]. The complex is shown in a ribbon diagram. White horizontal bars mark the boundaries of the membrane. Color code: yellow, MalE; cyan, MalF; red, MalG; green and magenta, MalK dimer. (B) Close-up view of the contact site between MalF P2 and the N-terminal lobe of MalE. The color code is the same as that for panel A. Residues from regions I and II that were replaced by cysteines are indicated in pink (MalF) and green (MalE). Residue MalE-K179, which was used as a control, is shown in green. The figure was drawn with DS ViewerPro 6.0 (Accelrys, Cambridge, United Kingdom), using the coordinates from entry 2R6G in the Brookhaven Protein Data Bank.

