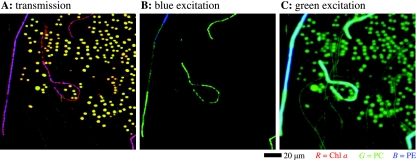
FIG. 4.
False-color images of a mixture of cyanobacterial cells, derived from the spectral images of transmission (A) and autofluorescence (B and C) obtained with a ×40 objective lens. The mixture consisted of the same cells that were used for Fig. 3A to C, which show the corresponding transmission and emission spectra of the cells. In panel A, the intensities of the red (R), green (G), and blue (B) channels correspond to the magnitude of fourth derivative of transmission at 675, 630, and 574 nm and represent the relative distributions of the photopigments Chl a, PC, and PE, respectively. In panel B, the green and blue color intensities represent the magnitudes of autofluorescence peaks at 653 and 588 nm excited by blue light and represent the distribution of PC and PE, respectively. In panel C, the green and blue color intensities represent the magnitudes of autofluorescence peaks in the regions at 650 to 653 nm and at 604 nm excited by green light and represent the distributions of PC and PE, respectively. Note that since the long-pass filter used for autofluorescence imaging with green excitation cut off the fluorescence peak of PE at ∼588 nm, the PE distribution was approximated by the fluorescence intensity at the closest available wavelength, 604 nm (Fig. 3C, dashed line). The fuzzy appearance of the green oval-shaped cells and the cyan filaments in panel C is due to the nonlinear color mapping applied to the final image to facilitate better visibility of the darker-green filaments. The scale bar is valid for all of the images.

