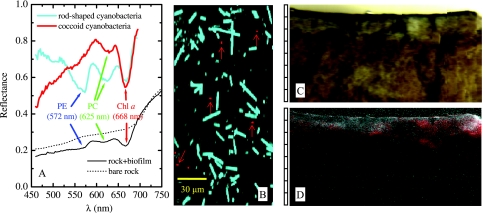
FIG. 5.
Spectral imaging of an endolithic biofilm. (A) Reflectance spectra of cells in a biofilm (cyan and red lines) and of the rock substrate with (solid black line) and without (dotted line) the cells. (B) Classified HS image for cells scratched off the biofilm surface and spread on a microscope slide. Cyan and red cells (indicated by arrows) correspond to classes characterized by the cyan and red spectra in panel A, respectively. (C) Direct image of a vertical cut in the rock, approximately as it appeared to the naked eye. (D) False-color image of the same cut obtained by pixelwise assignment of the fourth derivative of the log-transferred reflectance at 668, 625, and 572 nm to the intensities of the red, green, and blue colors, respectively. The scale to the left of panels C and D is in millimeters.

