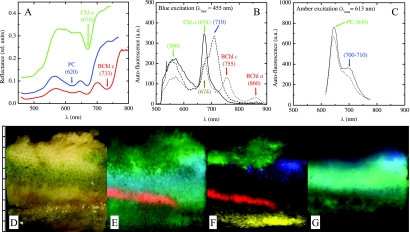
FIG. 6.
Spectral imaging of a vertical section of a photosynthetic microbial mat. (A to C) Average reflectance (A) and autofluorescence (B and C) spectra for several selected areas in the mat. The arrows and the corresponding wavelengths (in nanometers) (in parentheses) indicate selected spectral features of pigments identified in the cells. (D) Direct image of the microbial mat, approximately as it appeared to the naked eye. (E) False-color image of the mat obtained by pixelwise assignment of the fourth derivative of the log-transferred reflectance at 733, 670, and 620 nm to the intensities of the red, green, and blue colors, respectively. (F and G) False-color images of the mat obtained using the magnitudes of the autofluorescence peaks indicated by the corresponding colors in panels B and C, respectively. The scale to the left of panels D to G is in millimeters. See text for additional explanation. rel., relative; a.u., arbitrary units.

