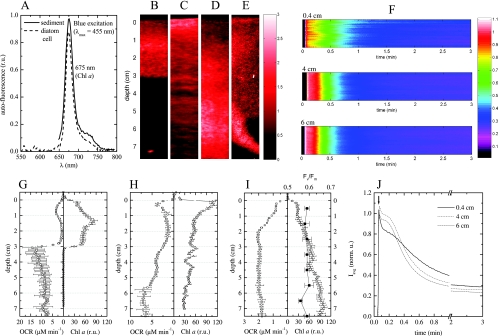
FIG. 7.
Combined spectral and oxygen imaging in permeable intertidal sediments. (A) Autofluorescence spectrum emitted by the Chl a-containing microorganisms in the sediment. The emission spectrum for a single cell of the diatom C. closterium is also shown for comparison. (B to E) Examples of Chl a distribution in the sediment cores, derived from the magnitude of the autofluorescence peak at 675 nm. (F) Slow kinetics of the variable Chl a fluorescence in a horizontal line of pixels (y coordinate) at three depths (indicated above the images) in the sediment core in panel D. The false color represents the normalized magnitude of the autofluorescence peak at 675 nm. The corresponding horizontal averages (Iavg) (i.e., averages for all pixels at a given depth) of these signals are shown in panel J (norm. u., normalized units). (G to I) The triangles indicate the depth profiles for Chl a concentrations in the sediment cores, calculated by horizontally averaging the two-dimensional distributions shown in panels B to D, although for calculation of relative units (r.u.) it was assumed that the concentrations were relatively comparable for the cores. The squares indicate vertical profiles of potential OCRs, determined by the flowthrough method, for the same cores. The filled squares in panel I indicate the depth profile for the dark-adapted photosynthesis yield of Chl a fluorescence (Fv/Fm), as measured with a pulse amplitude modulated fluorometer for the homogenized sediment samples collected at 1-cm depth intervals for the core shown in panel D.

