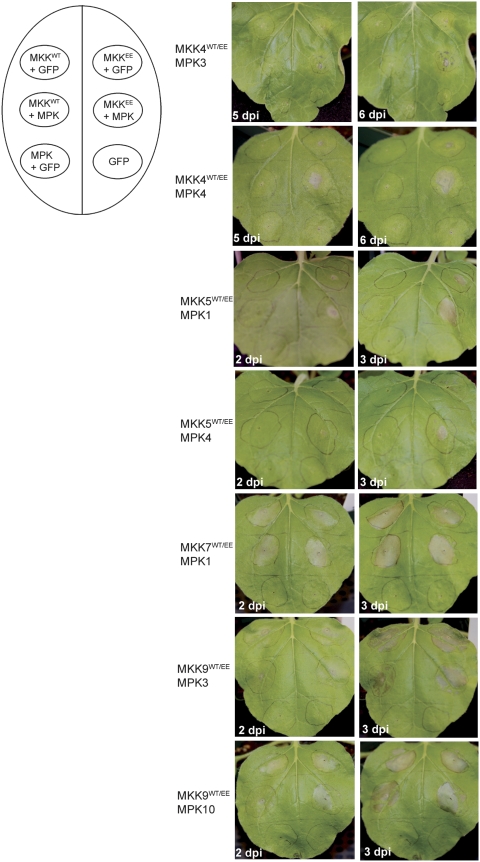
Figure 6.
Cell death phenotype induced by overexpression of several MKK/MPK modules in N. benthamiana. The diagram on the left represents the position on the leaf and the description of the infiltrated samples. The phenotype of infiltrated leaves shown on the right was monitored for several days post infiltration (dpi). Representative leaf pictures from two consecutive days for each experiment are shown.

