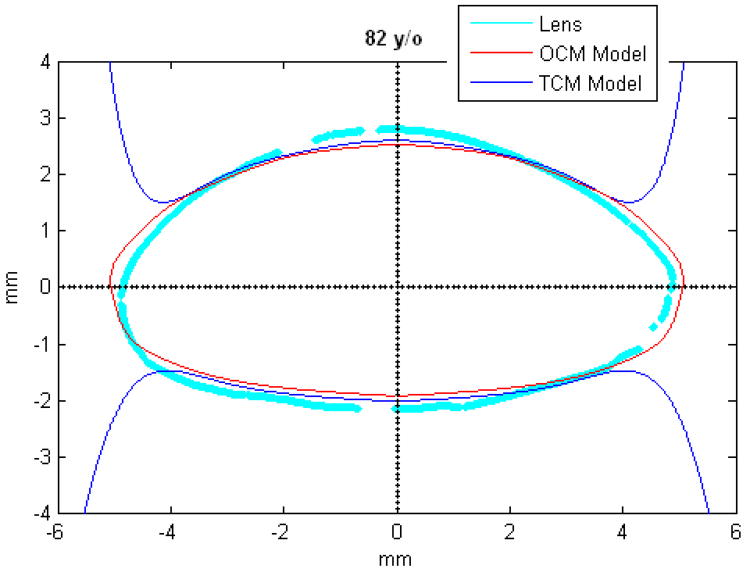
Figure 11.
TCM (blue) and OCM (red) models superimposed on the profile of lenses (cyan) of various ages. The TCM and the OCM models were plotted with coefficients obtained via linear regression presented in Table 3. The differences between the models and the lens profiles are due to variability of individual lenses.

