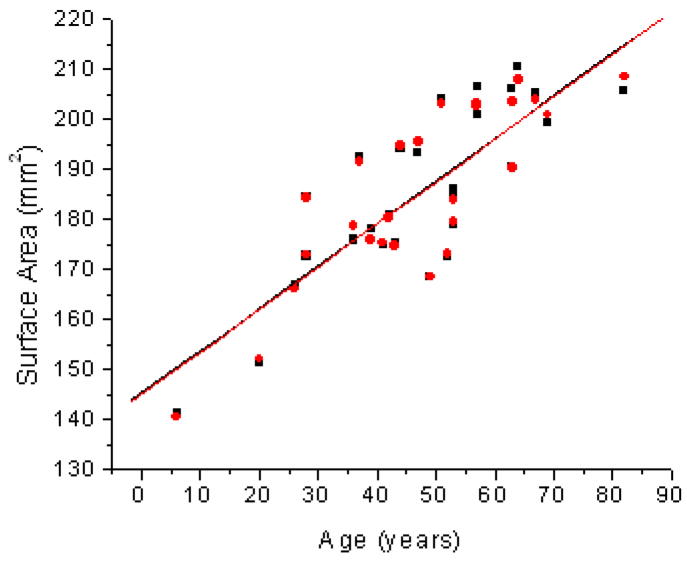
Figure 5.
Age related changes in Surface Area (SA) of the human lens for the One Curve Method (OCM; ●) and the Two Curves Method (TCM; ■). Linear fits of the data indicated SA = 145.0 (±5.8) + 0.85 (±0.11) × Age (R2=0.68; p<0.0001) for OCM and SA = 145.2 (±6.0) + 0.8 (±0.1) × Age (R2=0.67; p<0.0001) for TCM.

