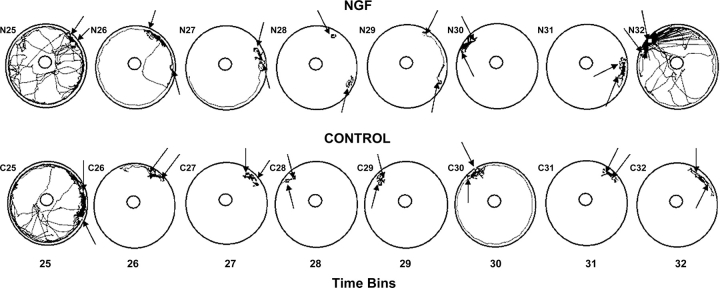
Fig. 7.
Digitized movement paths of control and NGF rat pairs for time bins 25–32. Each time bin represents 30 minutes. The rat pairs whose data appear in this figure are those whose mean distance apart data for time bins 25–32 were closest to the mean values of their respective groups. The squares embedded in the paths represent the most common position of the rats for each time bin. The squares are indicated by arrows for clarity.

