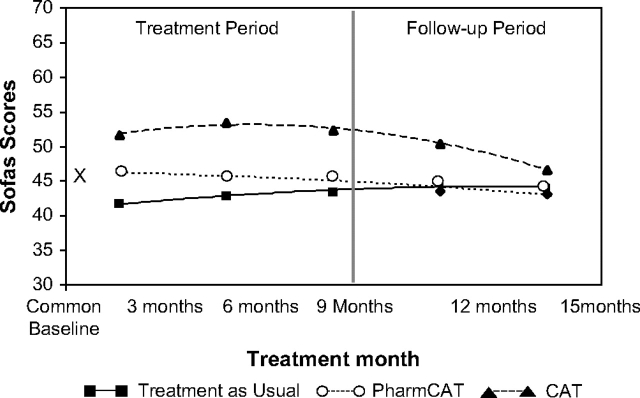
Fig. 4.
Social and Occupational Functioning Scale Score (SOFAS) Over Time by Treatment Group. Main effect of group—F2,147 = 113.38; P < .0001; visits by group (linear)—F2,202 = 4.85; P < .009; visits by visits by group (quadratic)—F2,290 = 3.51; P < .032. P values for cognitive adaptation training (CAT) vs standard treatment were .0001 for all time periods but P < .07 for 15 months. P values for Pharm-CAT (CAT focused only on medication and appointment adherence) vs standard treatment were <.014 at 3 months, .043 at 6 months, and nonsignificant thereafter. P values for CAT vs Pharm-CAT were .004, .0001, .0001, .0004, and .37 for 3,6,9,12, and 15 months, respectively.

