Fig. 3.
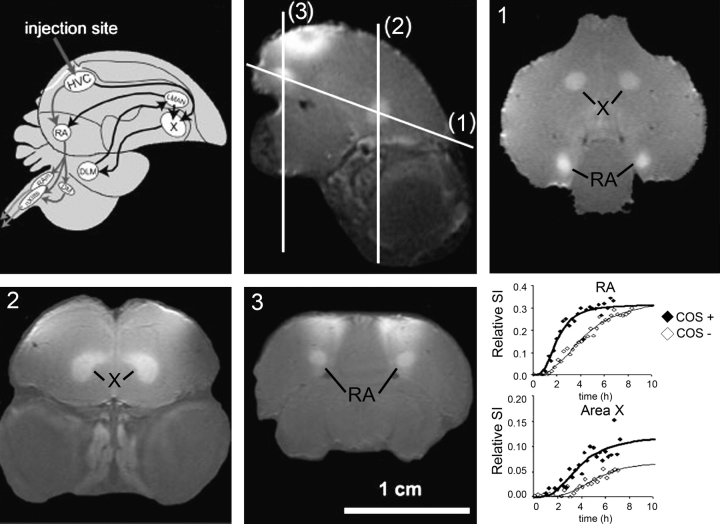
Schematic overview of the adult songbird brain showing the song control nuclei (SCN) and their connections in the telencephalon (top row, left panel). The black arrows represent the anterior forebrain pathway, which originates from the high vocal center (HVC) to area X, while the gray arrows represent the motor pathway, which originates in distinct cell populations within the HVC that project to the nucleus robustus archistriatalis (RA). Sagittal in vivo MEMRI of a male starling brain obtained 6 h after MnCl2 injection into the HVC (top row, middle panel). The injection area is indicated by the gray arrow in the left panel and by the enhanced superficial area on the MEMRI. The lines indicate the different planes of imaging labeled (1), (2), and (3), which are displayed on the right panel in the top row and on the left and middle panels of the bottom row, respectively. The areas enhanced by Mn2+ are indicated in the MEMRI images. Adapted with permission of A. Van der Linden et al.30 Bottom row, right panel: Changes in the MEMRI relative signal intensity within the 2 song control nuclei (RA and area X) are plotted as a function of time and fitted by nonlinear regression to a sigmoid curve to describe the kinetics of Mn2+ accumulation in the RA (top graph) and in area X (bottom graph) and reflects the activity of the respective HVC neuron type. A faster uptake of Mn2+ was observed in both areas when the canary was allowed to listen to conspecific canary songs (COS+) while in the magnet relative to the control situation, without song stimulation (COS−). Adapted with permission of Tindemans et al.33

