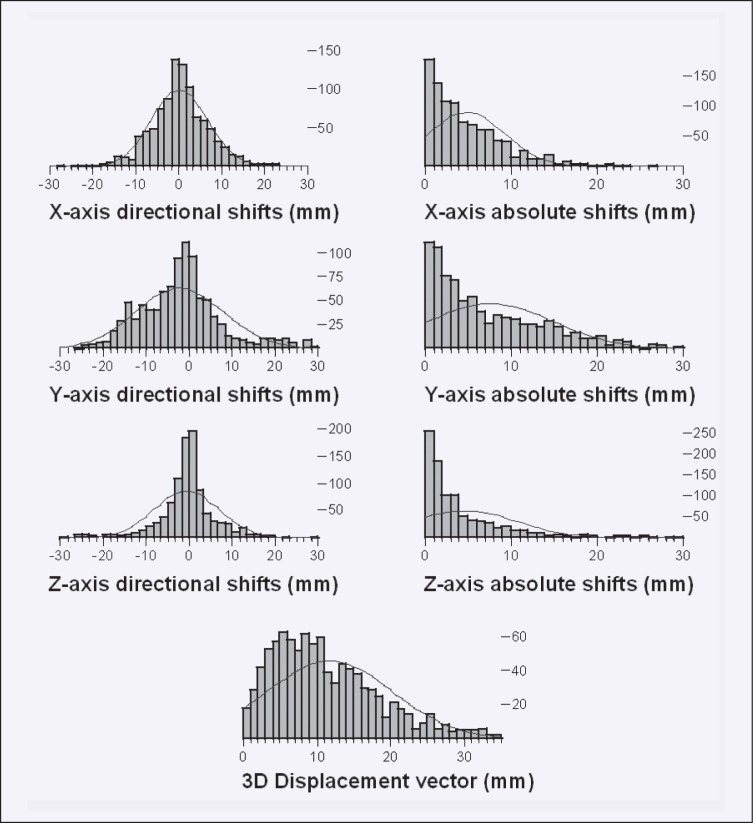
Figure 4.
Display of frequency (y-axis) of directional shifts (left figures, x-axis), and absolute shifts (right figures, x-axis) along the x-, y-, and z-axes. Fitted onto the frequency of observed length of shifts are Gaussian distributions. The lowest figure displays the frequency (y-axis) and length of the 3D magnitude vector of corrective shifts (x-axis).

