Figure 7.

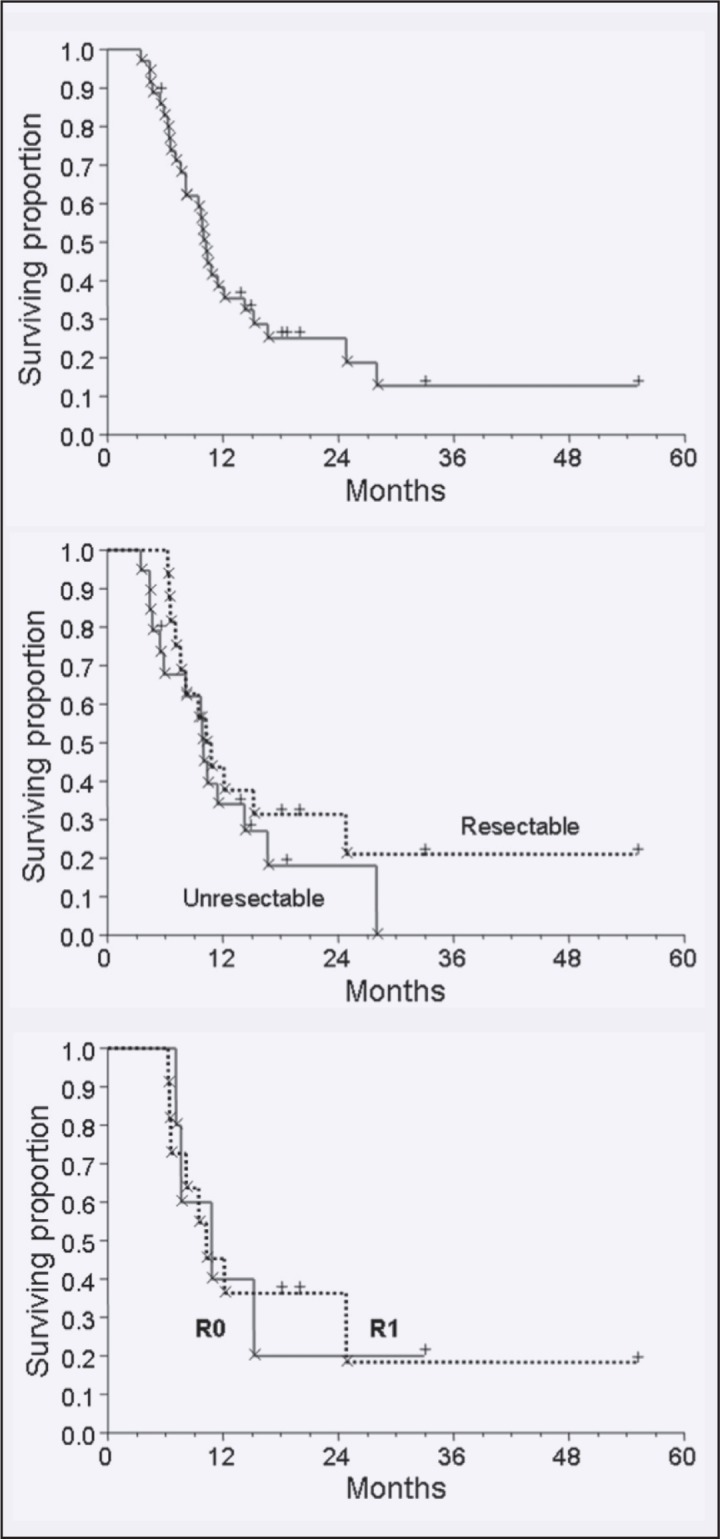
Kaplan-Meier actuarial survival curves for the entire cohort (top); for adjuvant radiotherapy vs. definitive radiotherapy of locally advanced disease (middle), and survival following complete vs. incomplete resection (low).

Kaplan-Meier actuarial survival curves for the entire cohort (top); for adjuvant radiotherapy vs. definitive radiotherapy of locally advanced disease (middle), and survival following complete vs. incomplete resection (low).