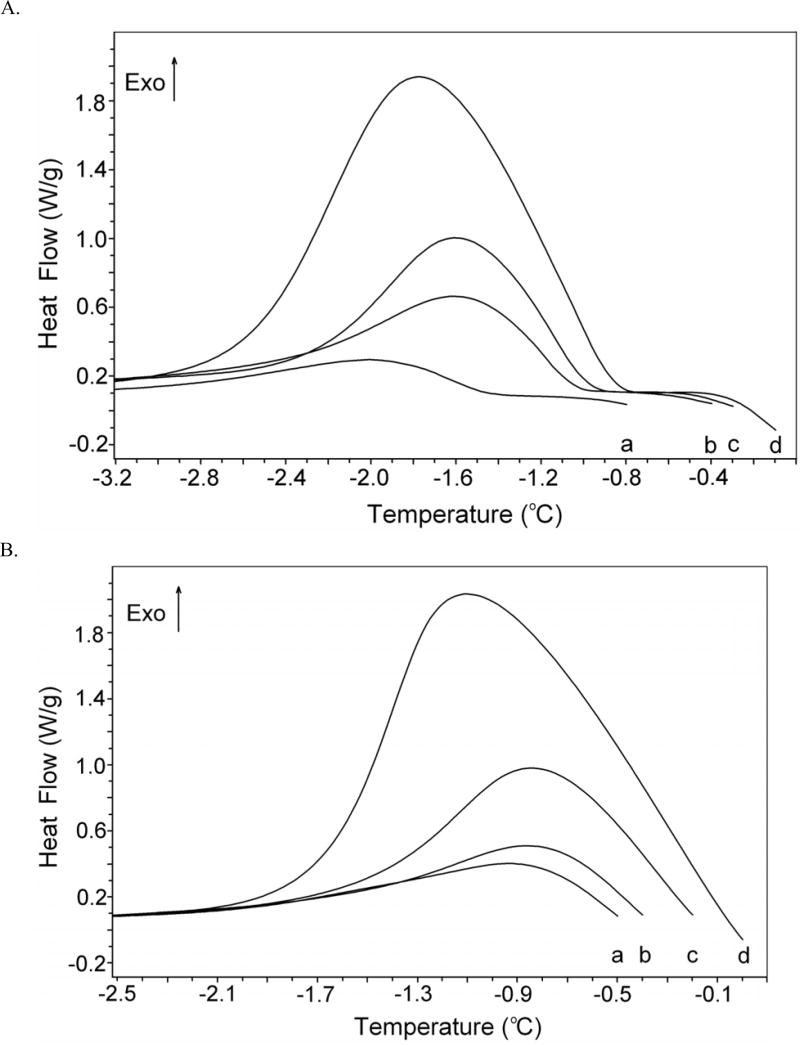
Fig. 1.
Differential scanning calorimetry (DSC) thermograms. (A) DSC thermograms of partially melted DAFP-1 (0.669 mM) at a rate of 1.00 °C/min illustrating its TH activity. The hold temperatures (Th) are indicated as positions a–d in the graph, respectively, are −0.80, −0.40, −0.30, and −0.10 °C. (B) DSC thermograms of partially melted BSA (0.303 mM) at a rate of 1.00 °C/min. The hold temperatures (Th) indicated as positions a–d in the graph, respectively, are −0.50, −0.40, −0.20, and 0.00 °C. The estimated percentages of the ice in the two samples are between 24 % and 7 %.

