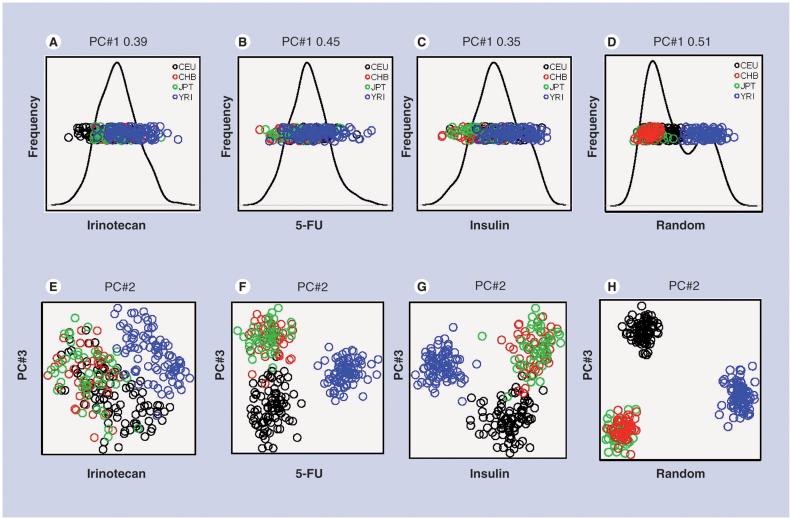
Figure 2. Principal components analysis of the 270 HapMap individuals.
PC#1 (A-D) and PC#2 versus PC#3 (E-H) across SNPs from (A, E) irinotecan, (B, F) 5-FU, and (C, G) insulin pathway genes and (D, H) 362 randomly chosen SNPs. Full PCA figures are available in Figure 2 of the Supplemental material available at [108].
PC: Principal component; PCA: Principal components analysis.

