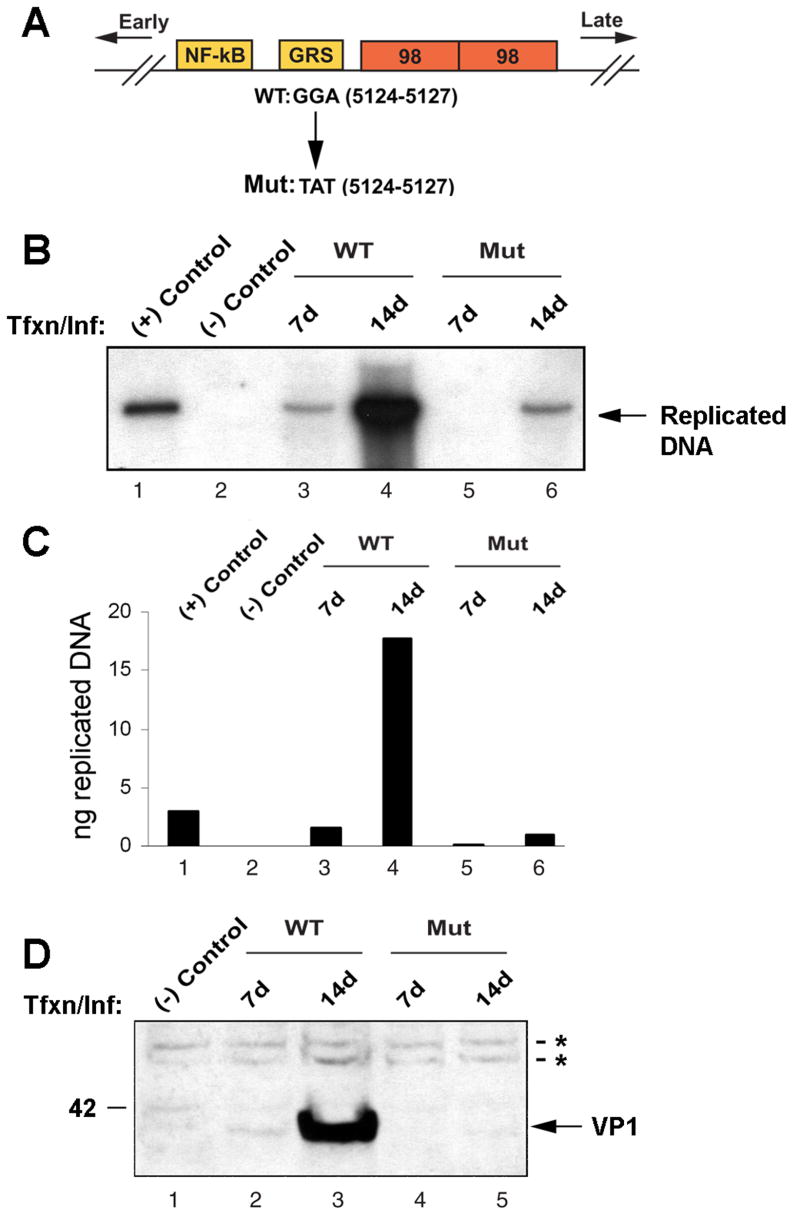
Figure 8. Virus with mutation of the Egr-1 binding site is defective in DNA replication and late gene expression.
A. A schematic representation of the JCV Mad-1 regulatory region indicating position of the trinucleotide mutation in the mutant virus. Orientation of early and late gene expression is indicated. The relative location of NF-κB, GRS and 98 bp tandem repeats are also indicated. GGA sequences in WT virus (JCV Mad-1, 5124–5127) were substituted with TAT sequences in the mutant virus. B. Analysis of DNA replication for the mutant virus. SVG-A cells were transfected/infected with either Mad-1 WT genome or its Egr-1 binding mutant genome (Mut, 8 μg/2 × 106 cells/75cm2 flask) using lipofectin as described in Materials and Methods. At 7d and 14d after transfection, low molecular weight DNA was isolated by a Qiagen spin columns, digested with Bam HI and Dpn I restriction enzymes, resolved on a 0.8% agarose gel and analyzed by Southern blotting. In lane 1, Mad-1 wild-type genome (3 ng) digested with Bam HI was loaded as a positive control. In lane 2, DNA isolated from uninfected cells was loaded as a negative control. C. A quantitative analysis of the data from panel B. The nitrocellulose filter from Panel B was analyzed using a Bio-Rad Molecular Imager FX phosphorimager and the intensity of each band measured using the Bio-Rad Quantity One Quantitation Analysis Software. The intensity of each band relative to the positive control (3 ng) was used to calculate the equivalent amount of replicated DNA in each sample. D. In parallel to the studies described for Panel B, whole cell lysates were also prepared at the time points indicated and analyzed by Western blot using an anti-VP1 antibody (AB597, kindly provided by W. Atwood, Brown University, Rhode Island). In lane 1, whole cell extract from untransfected/uninfected cells was loaded as a negative control. Tfxn: transfection, Inf: infection. The migration pattern of a molecular weight marker is shown on the left side of the panel in kilodalton. The asterisks indicate nonspecific bands present in uninfected and infected cells that serve to show equivalent protein loading.

