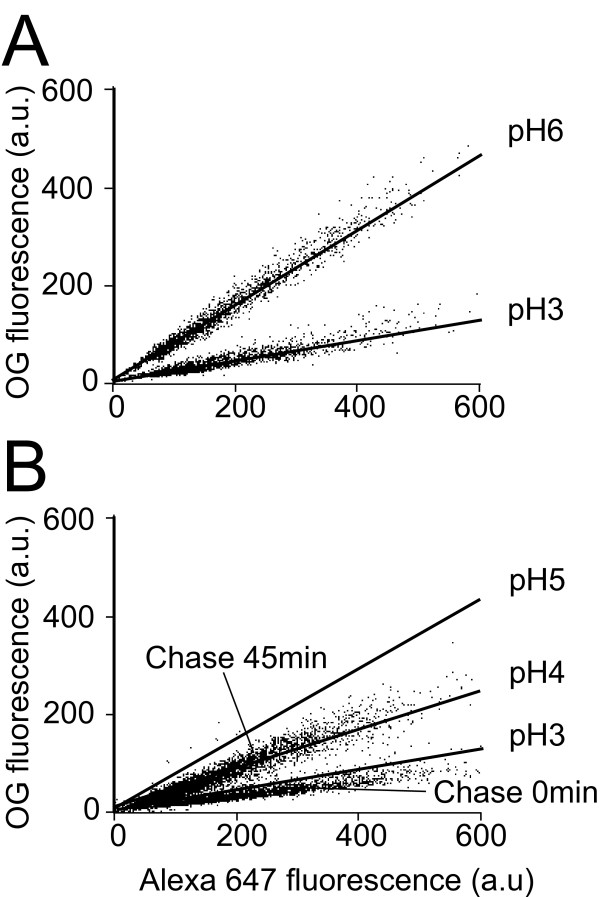
Figure 3.
Single-cell endosomal pH determination. (A) To calibrate this experiment, cells having internalized a mixture of fluorescent dextrans were incubated at a defined pH in the presence of sodium azide and ammonium chloride, and analyzed by flow cytometry as described in Figure 2. Each dot represents a single cell with the indicated fluorescence values. For comparison, cells incubated at pH3 and pH6 were both represented in one single graph. The lines drawn separate in two equal parts each population of cells. (B) Cells were allowed to internalize fluorescent dextrans, then further incubated in medium for either 0 minutes or 45 minutes. While the amount of endocytosed dextran was extremely variable from cell to cell, the fluorescence ratio, indicating endosomal pH, was remarkably conserved.

