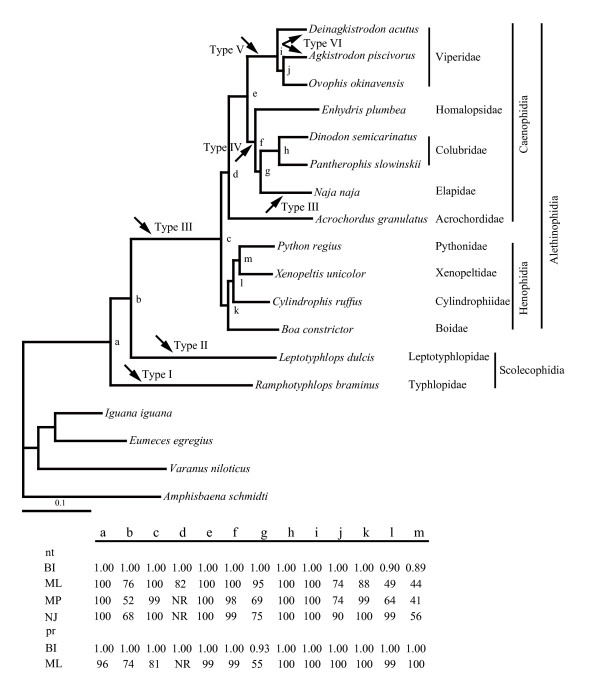
Figure 2.
Phylogenetic analyses of the amino acid and nucleotide sequence data sets. The phylogram shown is the best maximum likelihood tree (-lnL = 34008.56) obtained from the nucleotide data set. Bar represents 0.1 mutations per site. Nodes receiving support by one or more of the applied phylogenetic methods, i. e., Bayesian inference (BI), Maximum likelihood (ML), maximum parsimony (MP), Neighbor-joining (NJ) are labelled with lowercase letters. nt = values obtained from the nucleotide data set; and pr = values obtained from the amino acid data set. Bootstrap and Bayesian inference values are listed in the table. NR means that the corresponding nodal relationship was not reconstructed in the tree topology. Types I to VI are corresponding to those in Fig. 1.

