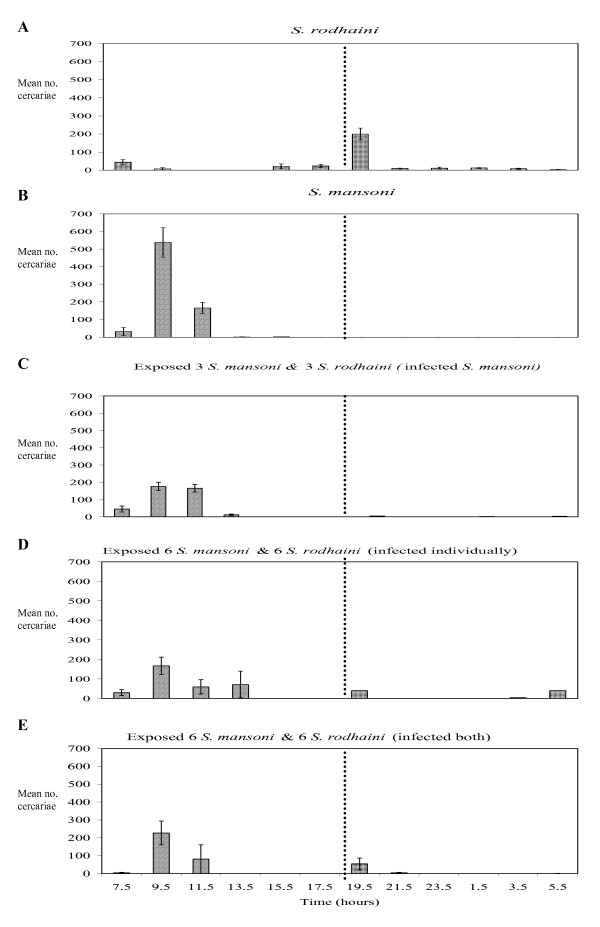
Figure 1.
Chronobiology of cercarial emergence. Chronobiology of S. mansoni and S. rodhaini cercarial emergence from snails individually infected with each species (A and B), snails doubly exposed at a dose of 3 miracidia of each species but only patently infected with S. mansoni (C), doubly exposed at a dose of 6 miracidia of each species but with only single patent infections of S. mansoni or S. rodhaini (D) and snails doubly exposed to a dose of 6 miracidia of each species and doubly infected (E) over a 24 hr period (+- SE), ( . . . . = transition from light to dark.)

