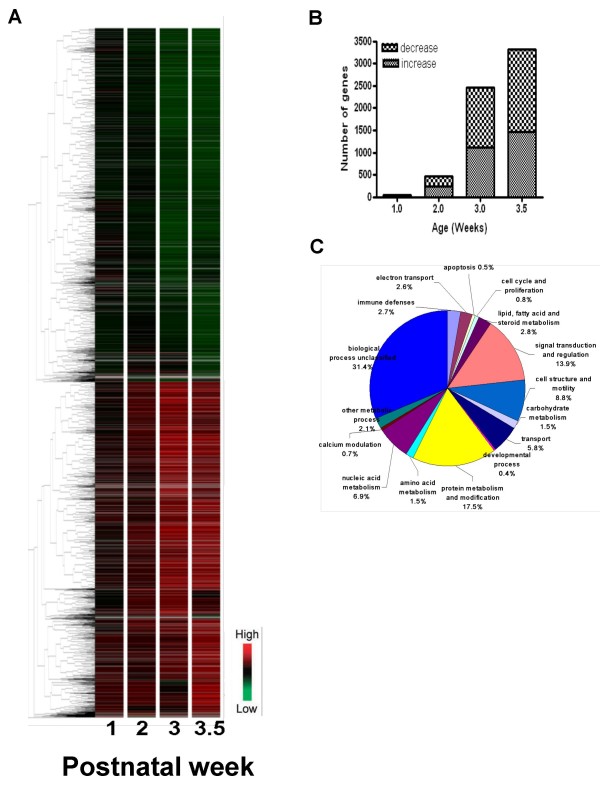
Figure 1.
Relative gene expression levels in Pkd1L3/L3 kidney compared to control. (A) Hierarchical clustering of Pkd1L3/L3/wild-type expression ratios for 4,231 genes differentially expressed in kidney at one or more ages between PNW 1 and PNW 3.5 (replicate samples normalized to wild-type at each age). Genes more highly expressed in Pkd1L3/L3 mice are indicated in red; those expressed in Pkd1L3/L3 mice at levels lower than wild-type mice are indicated in green. Red and green represent up- and downregulation, respectively (see scale in lower right corner). Ten gene clusters were identified as labeled at right. Vertical black bars on the sides (1,917 downregulated genes in A1–A5, and 1,806 upregulated genes in A6–A10) indicate regions with characteristic gene expression change patterns. (B) Numbers of differentially regulated genes by age in Pkd1L3/L3 mice. (C) Functional class proportions of all genes differentially expressed in Pkd1L3/L3 and wild-type mice from all time points (PNW 1, 2, 3 and 3.5).

