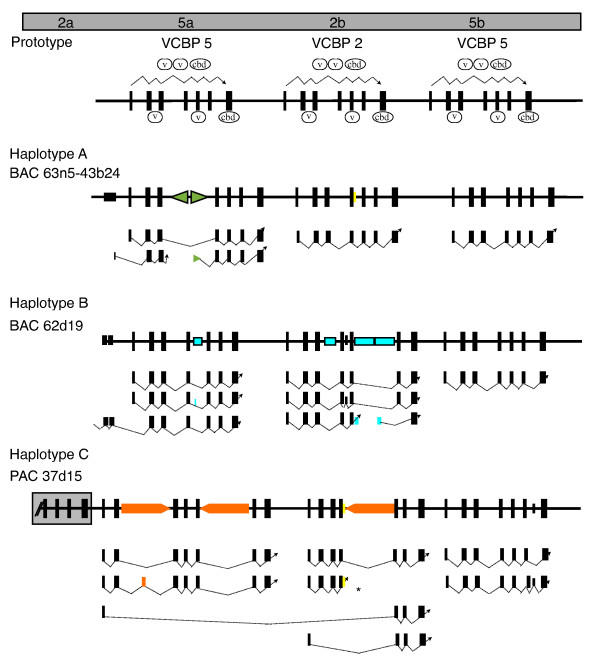
Figure 4.
Sequence variation and transcriptional profiles of the VCBP2/5 genes in three haplotypes. The VCBP2/5 cluster is depicted with conserved exon (vertical bars) and intron organization (see Fig. 2); a conventional splicing pattern (dotted arrow line) is shown above the line. Predicted, as well as experimentally validated, splice variants are indicated below exon/intron organization diagrams. Haplotype-specific inserts are shown as condensed (colored) shapes between exons (green = ribonucleotide reductase gene fragments forming inverted repeats, blue = fragmented coding regions for gypsy-type mobile element and red = three identical copies of a sequence related to LINE-like elements); arrowheads are intended to represent orientation relative to paired repeat partners.

