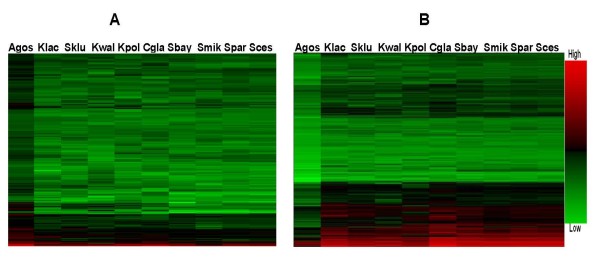
Figure 1.
tAI profile of orthologous gene in Group I and II. A) tAI values for orthologous genes in Group I (tAI values in A. gossypii are significantly higher than those in yeasts); B) tAI values for orthologous genes in Group II (tAI values in A. gossypii are significantly lower than those in yeasts). The scale of tAI values is shown to the right of the figure. (Agos: Ashbya gossypii; Sces: Saccharomyces cerevisiae; Spar:Saccharomyces paradoxus; Smik:Saccharomyces mikatae; Sbay:Saccharomyces bayanus; Cgla:Candida glabrata; Kpol:Kluyveromyces polysporus; Kwal:Kluyveromyces waltii, Sklu: Saccharomyces kluyveri; Klac:Kluyveromyces lactis).

