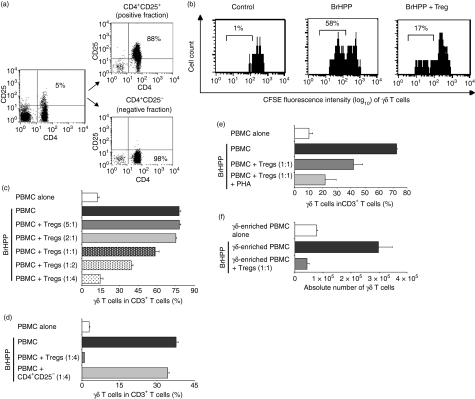
Figure 3.
Inhibitory effects of purified regulatory T cells (Tregs) on phosphoantigen-induced γδ T-cell proliferation. (a) CD4+ CD25+ Tregs were isolated from peripheral blood mononuclear cells (PBMC) by using a FACSVantage cell sorter cytometer. After sorting, the CD4+ CD25+ fraction and the CD4+ CD25− fraction were reanalysed to confirm enrichment and purity (88% versus 98%, respectively) as shown for one representative donor. (b) After depletion of αβ T cells a carboxyfluorescein succinimidyl ester (CFSE)-labelled γδ T-cell line was incubated with medium alone or bromohydrinpyrophosphate (BrHPP, 1 μm) and co-cultured with autologous purified Tregs at a ratio of 1 : 2·5. On day 6, cells were analysed by flow cytometry. γδ T-cell receptor (TCR)/CD3 double-positive T cells were gated, and loss of CFSE represented proliferation of gated cells. The percentage of proliferating cells is indicated for one representative donor. (c, d) PBMC were incubated with medium alone or BrHPP (1 μm) and co-cultured (c) with autologous purified Tregs at the indicated ratios or (d) with the CD4+ CD25− T-cell fraction. On day 7, proliferation of γδ T cells was analysed by flow cytometry. (e) Stimulation of Tregs with phytohaemagglutinin (PHA; 2·5 μg/ml). (f) Preserved inhibition of phosphoantigen-induced γδ T-cell proliferation by Tregs after depletion of other PBMC populations [αβ T cells, B cells, natural killer (NK) cells and monocytes]. Representative results are shown after depletion of αβ T cells within PBMC. Similar results were obtained after depletion of B cells, NK cells or monocytes. After depletion of αβ T cells, 2 × 10⁴γδ T cell-enriched PBMC (25%γδ T cells in PBMC) were incubated with medium alone or BrHPP (1 μm) and co-cultured with autologous Tregs at a ratio of 1 : 1, which corresponds to a γδ T-cell:Treg ratio of 1 : 4. On day 7, proliferation of γδ T cells was analysed by flow cytometry, and absolute γδ T-cell numbers are shown. Each bar represents mean values ± standard deviation of triplicate cultures from one representative of at least three independent healthy donors.

