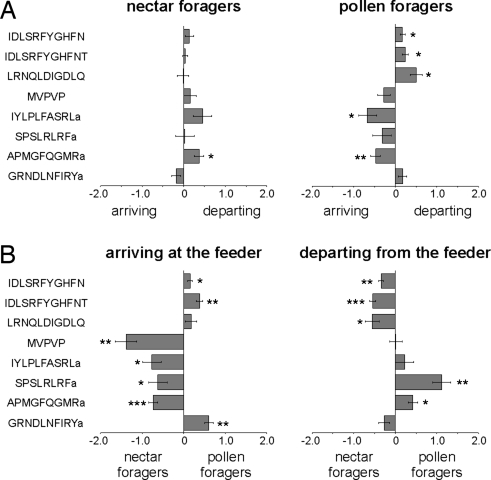
Fig. 2.
Differences in brain peptide abundances between 4 behaviorally different honey bee forager groups. (A) Relative differences in peptide abundances between arriving and departing nectar or pollen foragers. (B) Relative differences in peptide abundances between nectar and pollen foragers arriving or departing from the feeder. x axis: normalized, log2 transformed and centered peptide ratios. Negative and positive values indicate the direction of change. MVPVP = MVPVPVHHMADELLRNGPDTVI. Indicated significance levels (Student's t test): *, P < 0.05; **, P < 0.005; ***, P < 0.0005.

