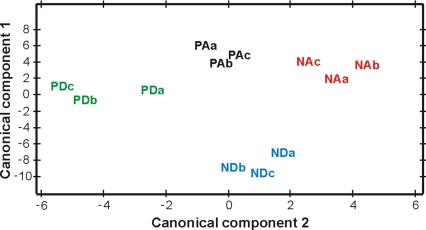
Fig. 3.
Peptide abundances reveal peptide signatures for foraging behavior. (A) A plot of the first 2 canonical components (which accounted for 98% of the variation in brain expression across all 4 groups) revealed strong group-specific expression patterns. (B) Peptide abundance signatures for the different behavioral groups (y axis indicates normalized log2 transformed intensity values). PA, pollen arriving; NA, nectar arriving; PD, pollen departing; ND, nectar departing; a, b, and c refer to three different bee colonies.

