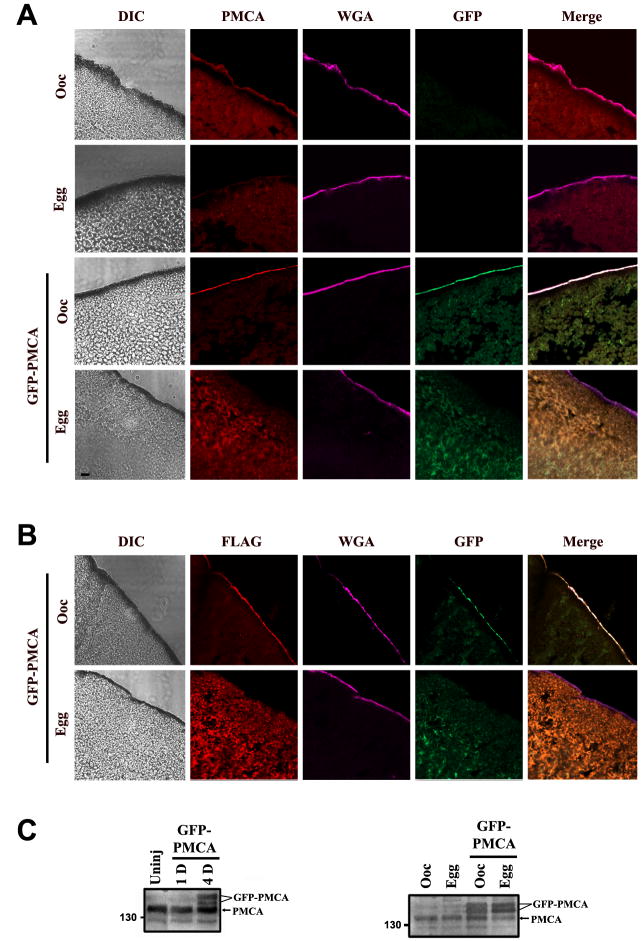
Figure 2. GFP-PMCA traffics in a similar fashion to endogenous PMCA.
A. Subcellular localization of endogenous PMCA and GFP-PMCA. Oocytes and eggs were fixed, sectioned, and stained with a pan PMCA antibody (red signal). Differential interference contrast (DIC), GFP (green), and wheat germ agglutinin (WGA, pink) images of the same slice are also shown. WGA-Alexa633 (pink) was used to stain the plasma membrane. The scale bar is 10μm. B. Similar staining as in panel A, except that an anti-Flag antibody was used to detect injected GFP-PMCA (Flag). For panels A & B the oocyte examples are representative of at least 30 similar cells and the egg examples are representative of 5-15 similar cells. All cells examined showed robust PMCA enrichment at the cell membrane in oocytes and undetectable levels in eggs. C. Left panel: Time course of PMCA expression using the pan PMCA antibody at 1 (1D) and 4 days (4D) after injection, as compared to uninjected cells (Uninj) (left panel). An equivalent of one cell was loaded in each lane. Right panel: Expression of GFP-PMCA as compared to endogenous PMCA using a PMCA1 isoform specific antibody (right panel). Oocytes refer to cells before progesterone treatment (Ooc) and eggs are mature cells (>3hrs after GVBD). An equivalent of ½ cell was loaded per lane.

