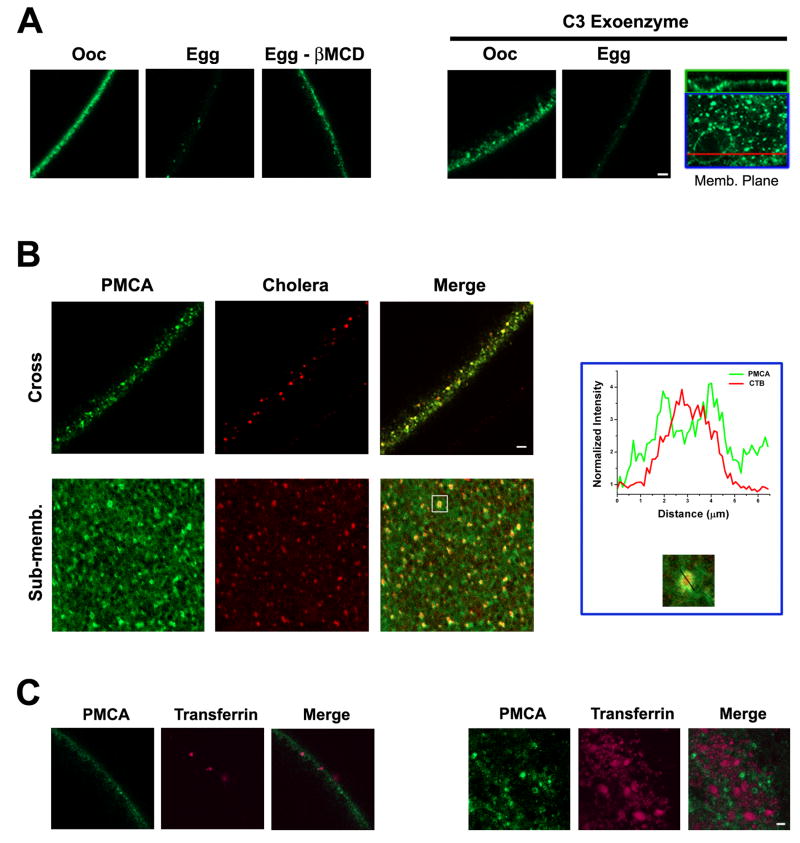
Figure 4. PMCA internalization.
A. To interfere with raft-dependent endocytosis oocytes were treated 2% methyl-β-Cyclodextrin (βMCD) 9hrs before progesterone stimulation. GFP-PMCA internalization is inhibited in cells pretreated with βMCD during oocyte maturation (Egg – βMCD) as compared to control cells (Egg). For the C3 Exoenzyme treatment, oocytes were injected with 1.7ng C3 exoenzyme 1hr before progesterone stimulation (Schmalzing et al., 1995). The C3 exoenzyme treatment increases membrane invaginations leading to a diffuse membrane appearance in the oocyte (Ooc). These invaginations appear as large circular structures at the cell membrane focal plane (inset). A cross section through these circular regions (red line) shows the invagination at the membrane (inset top). Even though membrane area is increased in C3 exoenzyme treated cells PMCA internalization is unaffected (Egg). The scale bar is 10 μm. B. GFP PMCA expressing cells were labelled with Alexa555-labeled B subunit of the cholera toxin (CTB) and imaged around GVBD to visualize PMCA internalization. In a cross-section the GFP-PMCA and CTB signals co-localize (Cross). In a focal plane that is 10-20 μm below the cell membrane (Sub-memb) the CTB and GFP-PMCA signals also co-localize. A close up view and line scan of fluorescence intensity through one of the PMCA and CTB positive vesicles shows CTB in the luminal core of the vesicle, while PMCA localizes the vesicle membrane. The scale bar is 5 μm. C. GFP-PMCA expressing cells at GVBD were labeled Alexa633-labeled transferrin and chased for different time points before imaging. No co-localization is observed between GFP-PMCA and transferrin. The scale bar is 10 μm. The examples shown are representative of 5-8 cells for each treatment.

