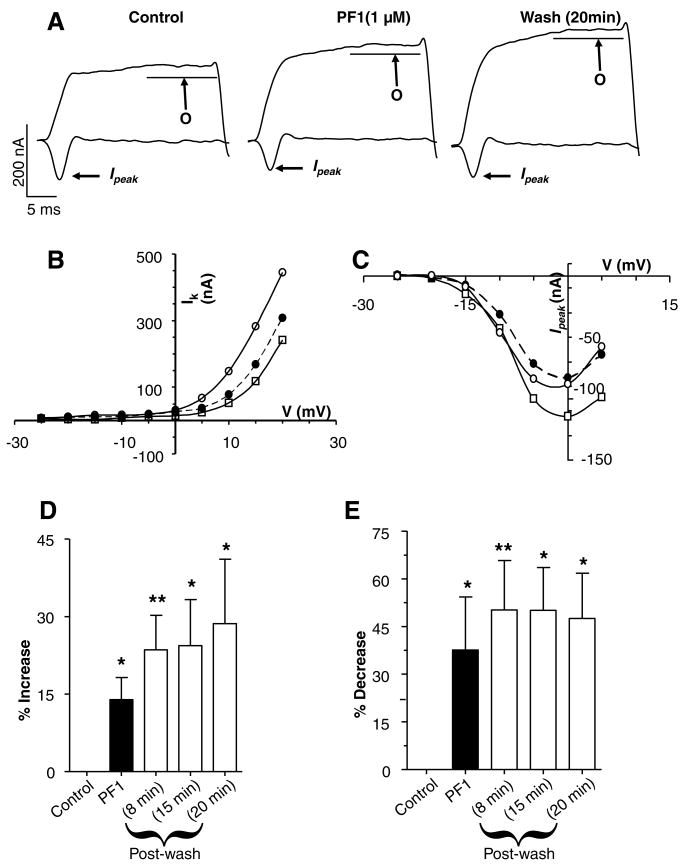
Fig. 3.
Effect of PF1 on voltage-activated currents. (A) Representative traces showing voltage-activated currents in control, during PF1 (1 μM) application and post-wash. Two currents observed outward potassium currents (O) and transient inward calcium current (Ipeak). Note the increase in the plateau of outward current and the decrease in the Ipeak current. (APF-Ringer no calcium or potassium channel block). (B) Current–voltage plot of the mean potassium current before, during and after PF1 (1 μM) application. Control:
 PF1 (1 μM):
 Post-wash:
 (C) Current–voltage plot of the calcium transient inward current (I) before, during and after PF1 (1 μM) application. Control:
 PF1 (1 μM):
 Post-wash:
 (D) Long-lasting potentiation of the mean (O) potassium current before, during and after PF1 (1 μM) application (paired t-test, n = 6, **P ≤ 0.01, *P ≤ 0.05). (E) Inhibition of the peak calcium transient inward current (Ipeak) before, during and after PF1 (1 μM) application (paired t-test, n = 6, **P ≤ 0.01, *P ≤ 0.05).

