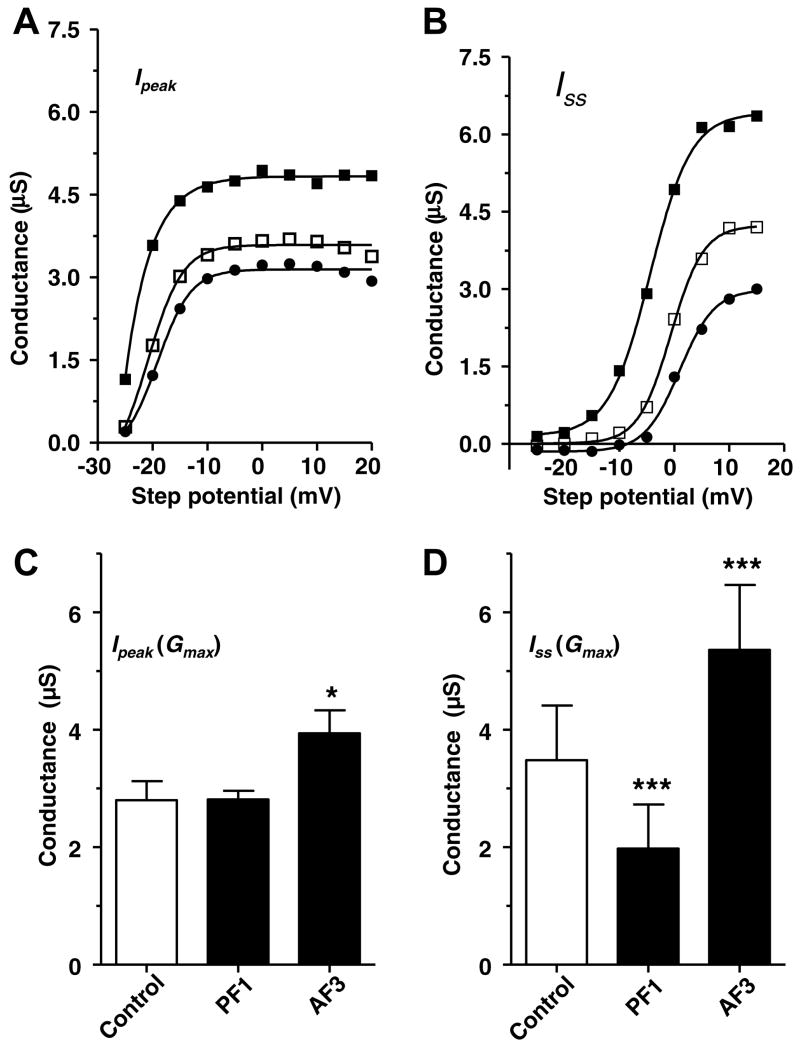
Fig. 9.
Activation curves for Ipeak & Iss. (A) Activation curves for Ipeak currents before and during application of PF1 & AF3. Control:
 PF1 (1 μM):
 AF3 (1 μM):
 (B) Activation curves for Iss currents before and during application of PF1 & AF3. Control:
 PF1 (1 μM):
 AF3 (1 μM):
 (C) Change in Gmax of Ipeak currents after AF3 application. (D) Change in Gmax of Iss currents after AF3 application.

