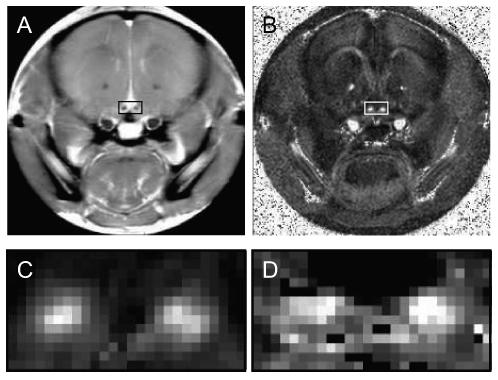
Figure 1.

A): the T2 weighted image of one coronal slice from a control mouse. Optic nerves are located inside the small rectangle. B): the relative anisotropy map of the same slice from this mouse. C): magnified relative anisotropy map inside the small rectangle. D): magnified pool size ratio map. RA maps have the best contrast between the optic nerve and surrounding tissues, therefore they were used to determine the position of the optic nerves and choose ROIs for each mouse.
