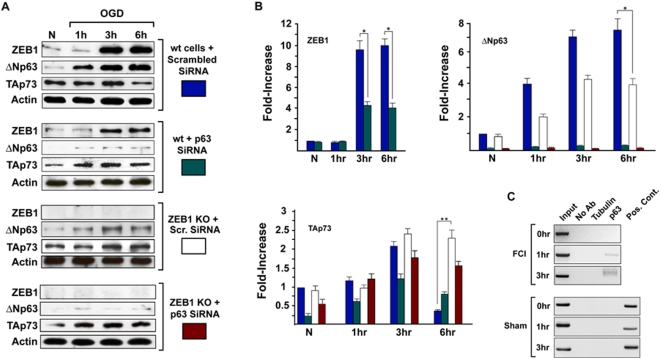
Figure 6. OGD-mediated ZEB1 protein induction depends significantly on p63.
(A) Primary cortical cultures from either wt or ZEB1 KO mice were transduced with lentiviral constructs expressing either scrambled or p63 SiRNA (see Materials and Methods for sequences). Western blots of protein lysates prepared at indicated time points were carried out using antibodies shown at left. Densitometry of normalized (to β-actin) expression/induction profiles are depicted graphically in (B). Results are representative of 3 separate experiments, carried out on independent primary neuronal isolates (done on different days). At the 3 hr time point, SiRNA-mediated reduction in p63 protein levels reduces OGD-mediated ZEB1 protein induction an average 60% (ZEB1 graph). The reduction in p73 protein levels in wt neurons between 3 and 6 hrs following OGD (see Figure 4, panel C, and the top panel of westerns, labeled: “wt cells+scrambled SiRNA” in this figure) is virtually eliminated in the absence of ZEB1 (TAp73 graph). Interestingly, the dramatic increase in OGD-mediated ΔNp63 protein levels (seen in the top panel of westerns, labeled: “wt cells+scrambled SiRNA”) was reduced by half in a ZEB1 KO background (see text). (C) ChIP assay using the pan-anti-p63 antibody (recognizing all isoforms in the transfection analysis, Figure 5, panel B) shows that, in the cortex, within 1 hr of FCI, p63 binds to the site depicted in Figure 5, panel A in vivo. Primers used are depicted schematically (in green) in Figure 5, panel A. Tubulin, negative control ChIP using heterologous anti-Tubulin Ab; Pos. Cont., PCR product from post-IP supernatant harboring p63 binding sites (see Methods). Error bars: S.E.M. * = p<0.01; ** = p<0.001.

