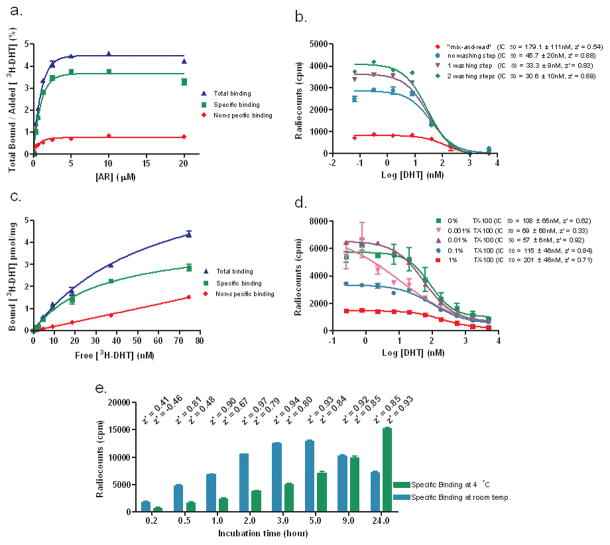
Figure 1.
Optimization of an AR SPA ligand competition assay. (a). Measurements of total binding (AR + 20 nM [3H]-DHT), non-specific binding (NSB: AR + 20 nM [3H]-DHT + 5 μM DHT) and specific binding (SB = total – NSB) for different AR concentrations after 2 washes. (b) Effect of washes: SB was measured for experiments carried out with 5 μM AR, serially diluted DHT in the presence of 20 nM [3H]-DHT. (c) Saturation binding plot: Measurements of total binding (5 μM AR), NSB (5 μM AR + 5 μM DHT) and SB for different [3H]-DHT concentrations. Bmax = 4.1 pmol/mg, Kd = 31.6 ± 9.3 nM. (d) Influence of Triton X-100 (TX-100): SB was measured for experiments carried out with 5 μM AR for incubation step, serially diluted DHT in the presence of 20 nM [3H]-DHT. (e) Incubation time course: measurements of SB after different incubation times at room temperature and 4°C. Corresponding z’ values are specified above columns.

