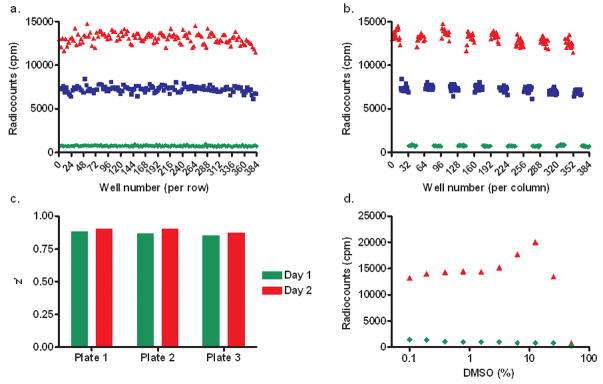
Figure 3.
HTS validation. Plate geographic effects investigation across rows (a), across columns (b). DHT was assayed at different concentrations in the presence 20 nM [3H]-DHT (▲ DMSO, ■ [DHT] = 50 nM, ◆ [DHT] = 5 μM). (c) Assay reproducibility: comparison of z’ values determined by using two independent assays performed in triplicates. (d) Assay stability: influence of DMSO content on radiocounts.

