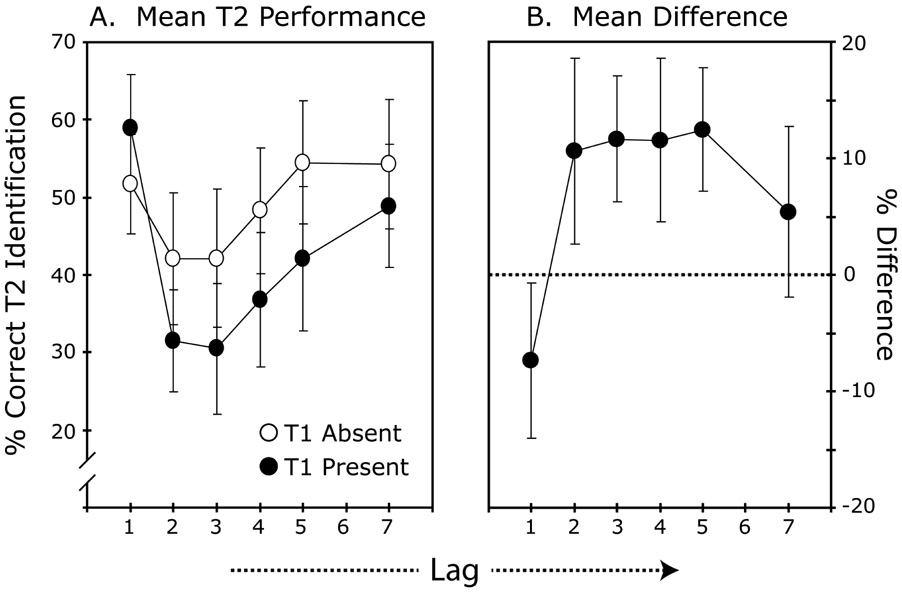
Figure 3. Results Experiment 2.
A. T2 identification performance for the T1-present and T1-absent conditions, plotted across lags. Results for the T1-present condition were pooled across only those trials on which T1 was correctly identified. Error bars show the standard errors of the means. B. Mean difference in T2 performance between the T1-absent and the T1-present trials with error bars showing the 95% confidence intervals.

