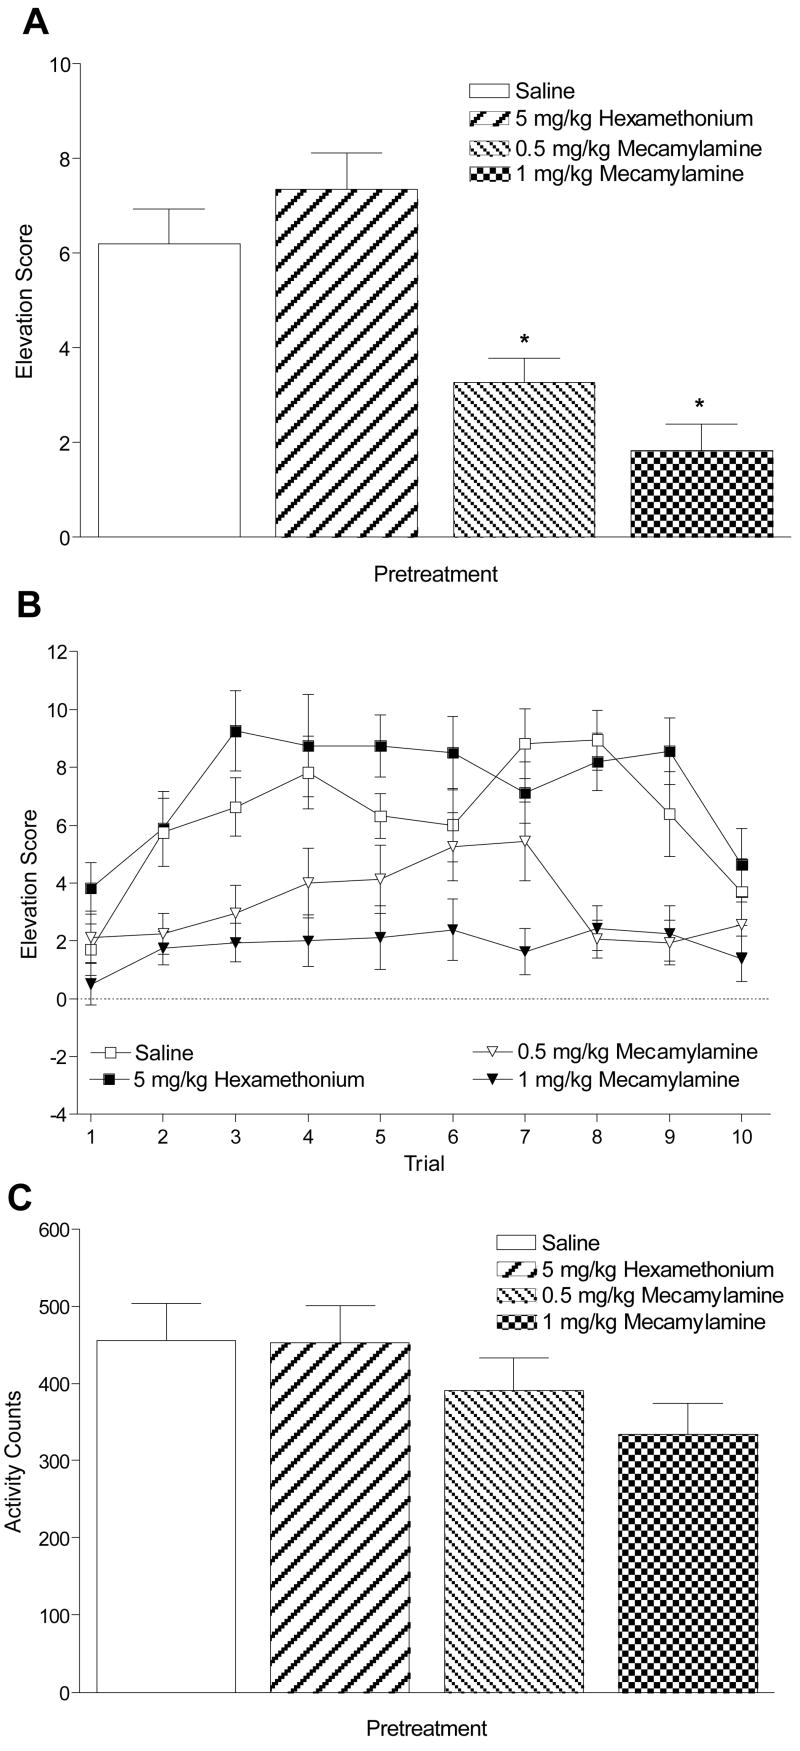
Figure 2.
Panel A shows mean elevation scores (+ 1 SEM) for the test sessions of Experiment 1. * denotes significant difference from saline pretreatment. Panel B shows mean elevation scores (± 1 SEM) for each trial of the test sessions. Significant differences from saline pretreatment are described in the text. Panel C shows mean (+ 1 SEM) total activity counts during test sessions.

