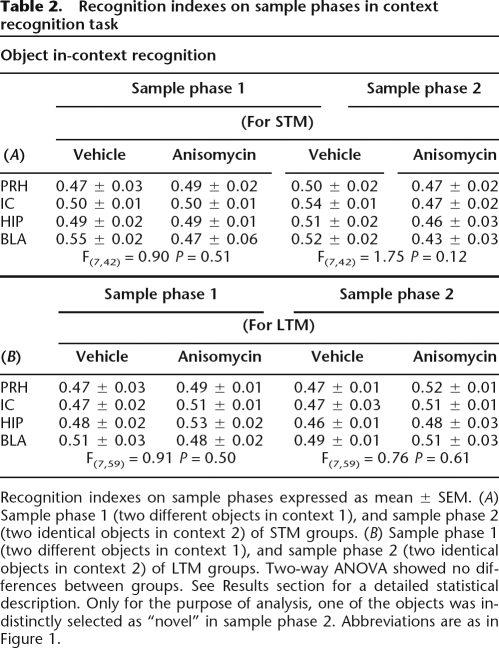
Table 2.
Recognition indexes on sample phases in context recognition task
Recognition indexes on sample phases expressed as mean ± SEM. (A) Sample phase 1 (two different objects in context 1), and sample phase 2 (two identical objects in context 2) of STM groups. (B) Sample phase 1 (two different objects in context 1), and sample phase 2 (two identical objects in context 2) of LTM groups. Two-way ANOVA showed no differences between groups. See Results section for a detailed statistical description. Only for the purpose of analysis, one of the objects was indistinctly selected as “novel” in sample phase 2. Abbreviations are as in Figure 1.

