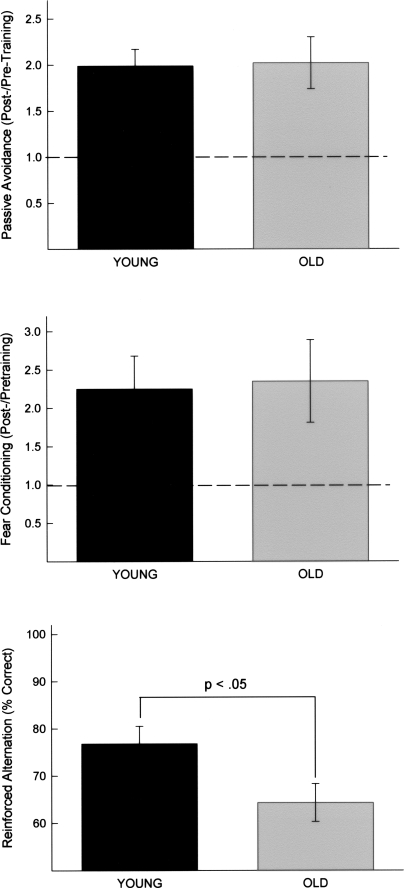
Figure 1.
(Top) Upon stepping from a safe platform, animals were exposed to a presentation of a bright light and loud noise. The mean ratio of post-training to pretraining step latencies is illustrated. Brackets indicate standard errors. (Middle) Animals received a tone (CS) paired with a mild foot shock (US). To measure the conditioned fear responses, the lick rates (of water-deprived animals) were assessed prior to and during the presentation of the tone CS. The latency to complete 25 licks prior to CS onset and the latency to complete 25 licks in the presence of the CS were determined for each animal. The mean ratio of CS to pre-CS latencies is illustrated. Brackets indicate standard error. (Bottom) Animals were trained to alternate between arms in a T-maze to obtain reinforcement. The percentage of correct response on Trials 6–11 was computed for each animal. This range of trials was chosen for analysis because, with our procedures, animals exhibit significant acquisition during this range, but most animals have not yet reached an asymptotic level of performance. The mean percentages of correct responses for Trials 6–11 are illustrated. Brackets indicate standard error.

