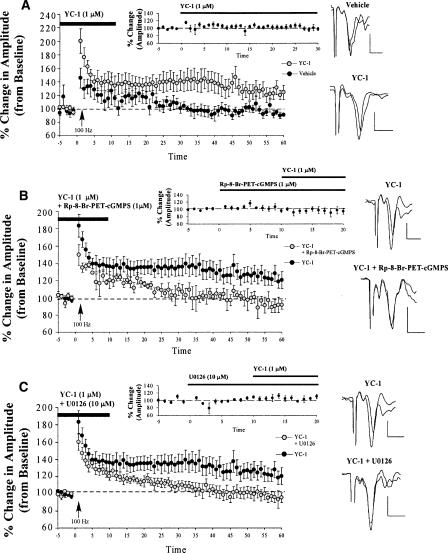
Figure 6.
LTP at thalamic inputs is enhanced by activating the sGC-cGMP-PKG signaling pathway. (A) Mean (±SEM) percentage field potential amplitude (relative to baseline) in slices treated with vehicle (n = 6; black circles) or 1 μM YC-1 (n = 8; gray circles). Traces from an individual experiment before and 50 min following tetanic stimulation and transmission following 20 min of bath application of drug are shown in the inset. (B) Mean (±SEM) percentage field potential amplitude (relative to baseline) in slices treated with 1 μM YC-1 (n = 13; black circles) or 1 μM YC-1 + 1 μM Rp-8-Br-PET-cGMPS (n = 5; gray circles). Traces from an individual experiment before and 50 min following tetanic stimulation and transmission following 20 min of bath application of drug are shown in the inset. (C) Mean (±SEM) percentage field potential amplitude (relative to baseline) in slices treated with 1 μM YC-1 (n = 13; black circles) or 1 μM YC-1 + 10 μM U0126 (n = 9; gray circles). Traces from an individual experiment before and 50 min following tetanic stimulation and transmission following 20 min of bath application of drug are shown in the inset. Note that the experiments in B and C were run simultaneously, so each experiment shares one control group (here graphed twice for the sake of clarity). Scale, 0.2 mV by 10 msec.

