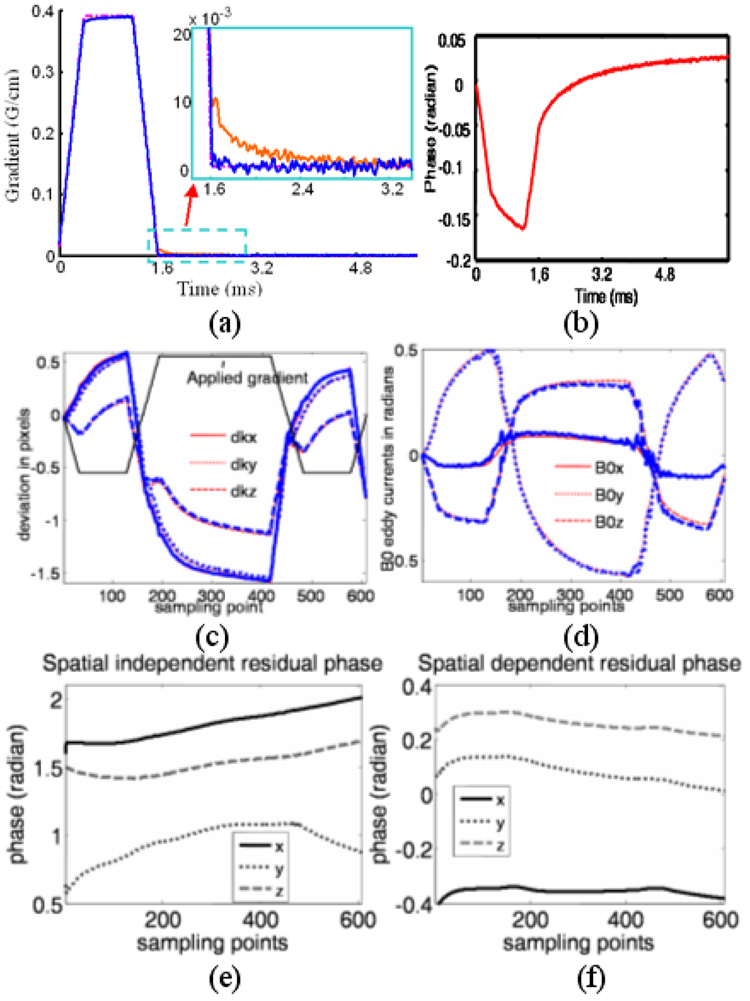
Figure 2.
a) Ideal (dash-dotted), measured selected gradients before (red) and after (blue) correction. Inset) an enlarged portion, showing the long time constant linear eddy current component in red. b) Measured phase due to B0 eddy currents before correction. The measured k-space deviations due to linear eddy currents from the applied gradient (arrow, not proportionally scaled) are shown in (c). The phase accumulated by B0 eddy currents is shown in (d). The thin, red lines show the eddy current terms calculated from data acquired with eleven gradients amplitudes and eight slice locations, while the thick, blue lines show the eddy current terms calculated using only four acquisitions. The residual phase that is independent of gradient amplitude, but linearly depends on position is shown in (e), and the phase that is independent of gradient amplitude and position is shown in (f). Both show little correlation with the readout gradient.

