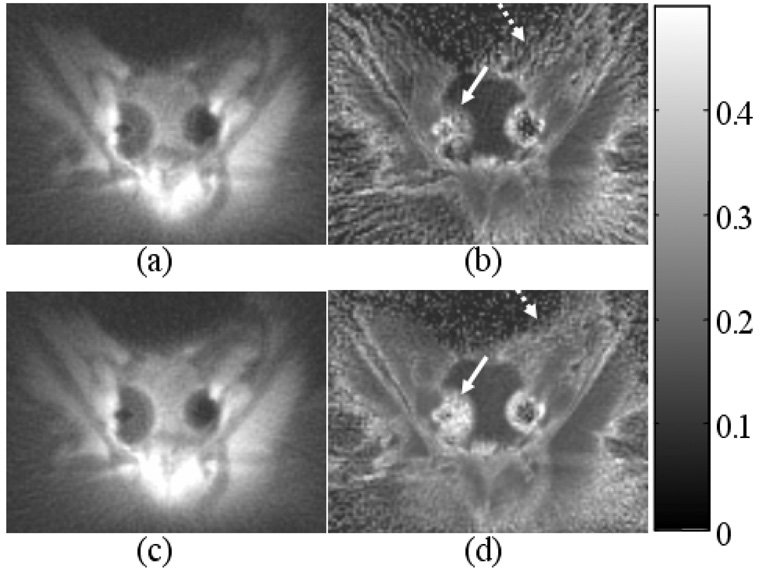
Figure 6.
Coronal magnitude images and R2* maps from two consecutive scans during a canine prostate cryoablation experiment demonstrate improved quality with linear and B0 eddy current correction for the half-pulse excitation. The time delay between these two scans is negligible. Two iceballs are shown, each created by a cryoprobe inserted on side of the prostate. (a) and (b) are magnitude image and R2* map acquired without correction. (c) and (d) are magnitude image and R2* map acquired with correction. The increase in signal to noise ratio and decrease in the streak artifact can be clearly appreciated in especially the R2* maps (arrows). The color bar on the right of the images shows the scale of R2* values in milliseconds. The SNR measured in a ROI indicated by the rectangle in b) and d) was 5 and 9 respectively.

