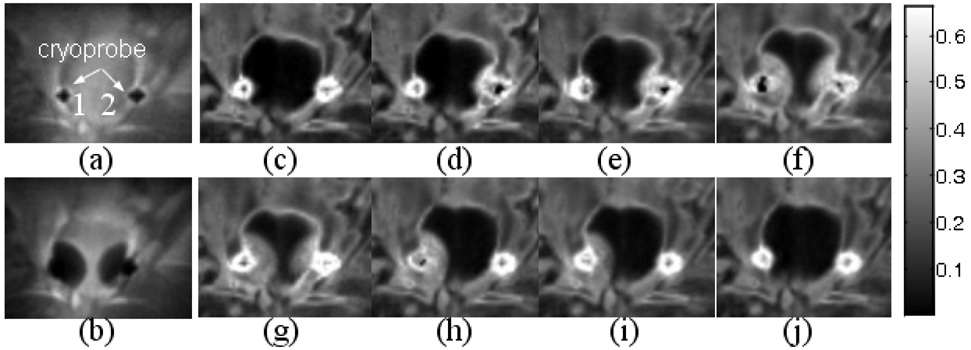
Figure 7.
Images acquired at several points during cryoablation. Magnitude images taken before at the height of freezing (a,b) demonstrate the cryoprobe position and the maximum size of the iceballs. The time series of R2* maps (c–j) show an iceball that is well depicted and the positions of the probes well defined in all images. The increase in R2* intensity with decrease in temperature is clearly seen. The color bar on the right of the images shows the scale of R2* values in ms. From figure 7c–j, the temperature readings near cryoprobe 1 were 36.6 °C, 33.5 °C, 20.6 °C, −1.0 °C, 0.1 °C, −8.4 °C, −0.8 °C, 11.0 °C and were 36.4 °C, 3.0 °C, 2.0 °C, −23.9 °C, −1.8 °C, 30.9 °C, 30.4 °C, 31.4 °C.

