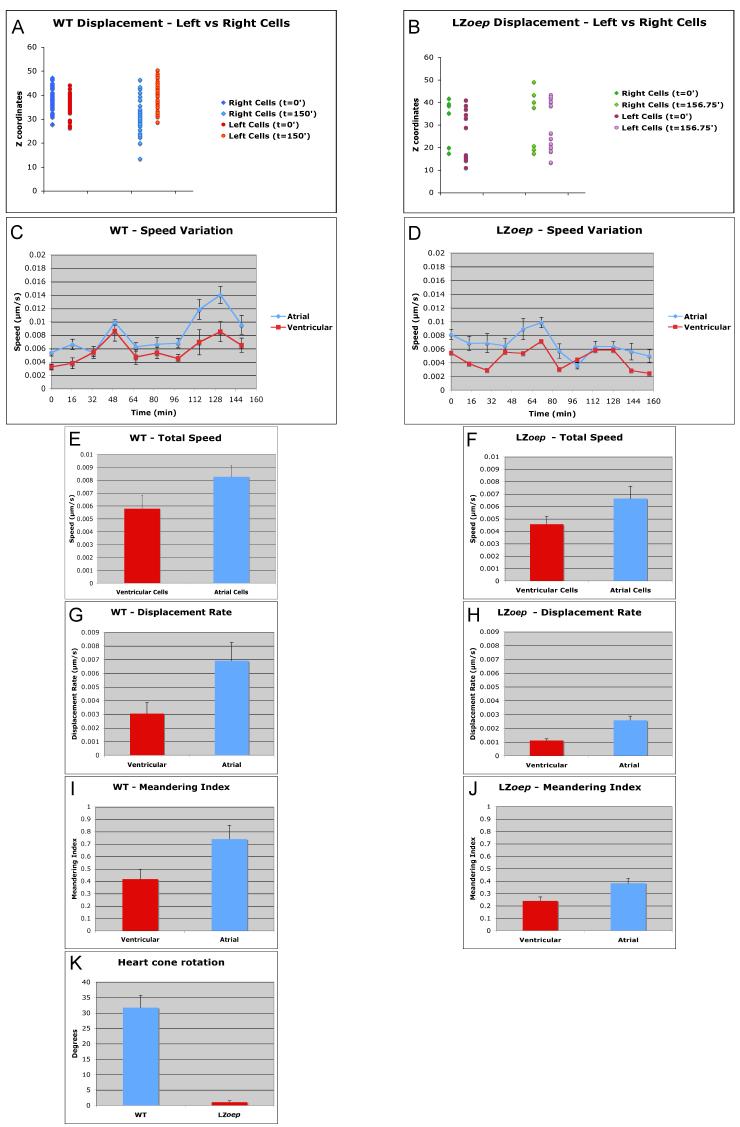
Figure 5. Quantitative analysis of left, right, ventricular and atrial cell movements in wild type and LZoep mutants.
Left and right cmlc2-GFP cells were tracked and Z-axis (dorsal-ventral) displacement of cells was measured. Note the asymmetric, ventral displacement of cells on the right in wild type (A) but not in LZoep mutants (B). Ventricular cells (located at the apex of the cardiac cone) and atrial cells (located at the base of the cardiac cone) were tracked using Imaris. Speed variation indicates speed of a cell during a given time interval. Total speed, displacement rate, and meandering index were determined as described in Experimental Procedures and Supplemental Figure 1. Note the higher speed (C and E), displacement rate (G) and meandering index (I) of atrial cells as compared to ventricular cells in wild-type. These differences are reduced in LZoep mutants. LZoep mutant cells have lower speed (D and F), displacement rate (H) and meandering index (J) compared to wild type. (K) Degree of clockwise rotation of cardiac cone. Note the lack of rotation in LZoep mutants. Statistics: E-K p<0.05.

