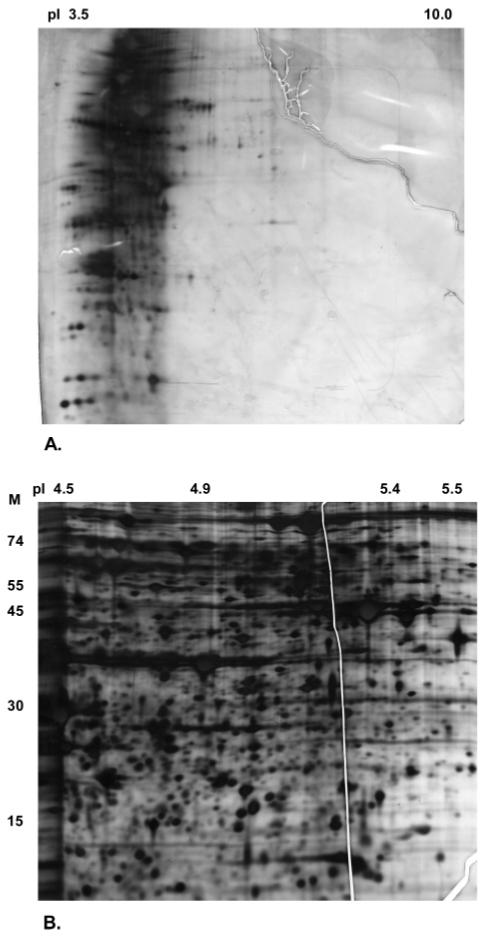
Figure 3.

2DE analysis of isolectric focusing fraction F2. (A) Further analysis of fraction F2 (pI 4.6-5.4) demonstrating the restriction of the proteins to the expected pI 4.6-5.4 region and minimal protein overlap between fractions by loading on a wide range (pI 3-10) 2D gel. (B) High-resolution gel image of the same fraction obtained after concentration and analysis on a matched narrow range zoom 2D gel.
