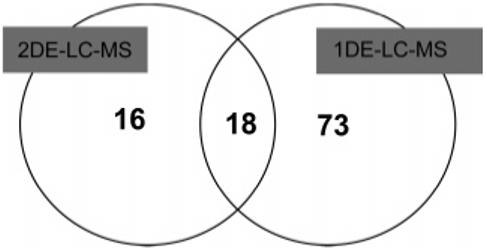
Figure 4.

Comparison of 2DE- and 1DE-LC–MS approaches using MicroSol fraction F2 (pI 4.6-5.4) for quantitation of plasmodial proteins. The analysis was restricted to proteins matching a predefined stringent quantitative filter criterion (3 top matched unique peptides in a Mascot search using MuDPIT scoring) for protein identification. Although the 1DE-LC–MS approach offered a 3-fold expansion in the quantitative profiling capacity, only 18 of the total 107 proteins were identified using both techniques, making the two approaches complementary.
