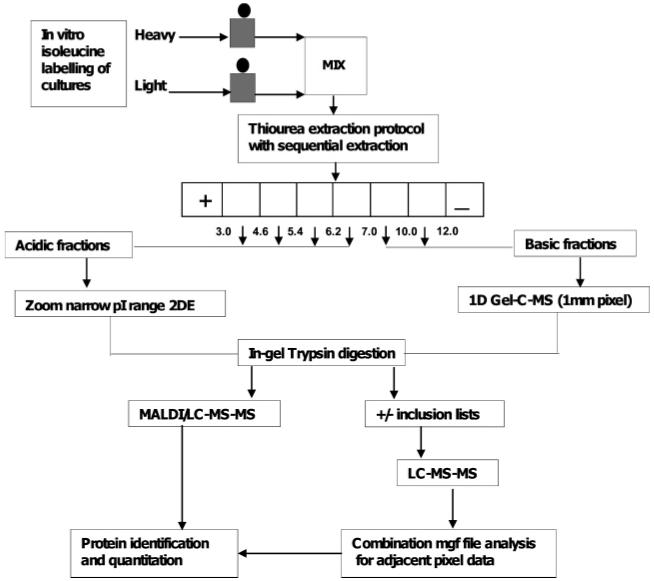
Figure 7.

Summary of the optimized proteomics workflow proposed for quantitative analysis of low to intermediate abundance proteins in the plasmodial proteome. Although acid proteins can be analyzed through either narrow range 2DE- or 1DE-LC–MS, the higher resolution spectra obtained following 2DE means that the former is preferred for quantitative work.
