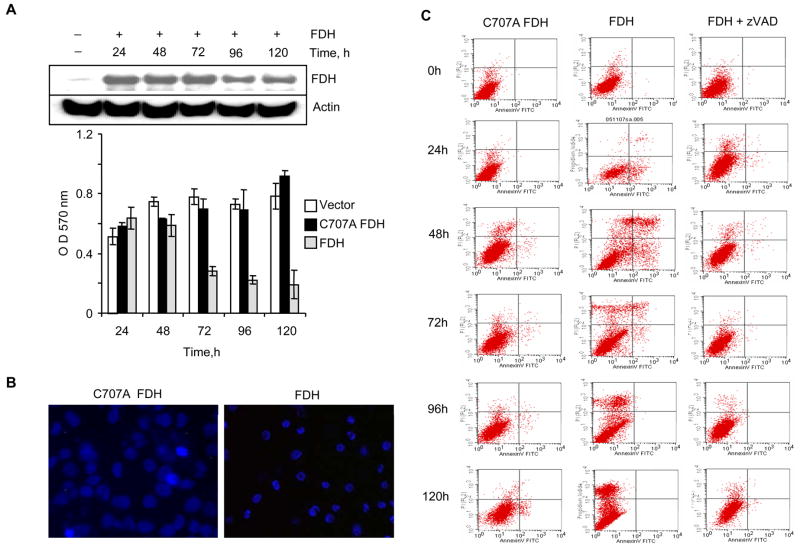
FIGURE 1.
FDH antiproliferative effects in PC-3 cells. A. Viable cells assessed by MTT assay at indicated time points after FDH expression (gray bars); C707A mutant expression (black bars); or after transfection with empty vector (control, open bars). Inset shows FDH levels evaluated by immunoblot. B. Fluorescence microscopy of Hoechst stained cells expressing FDH or its C707 mutant. Cells were incubated with Hoechst 33258 (2.5 μg/ml) for 10 min and examined using Olympus IX70 fluorescent microscope. C. Apoptosis detected by fluorescence activated cell sorting (FACS) flow cytometry in PC-3 cells. Left panel (control), cells transfected for inactive C707A FDH expression; middle panel, cells transfected for FDH expression; right panel, cells transfected for FDH expression in the presence z-VAD-fmk. Time post-transfection is indicated.

