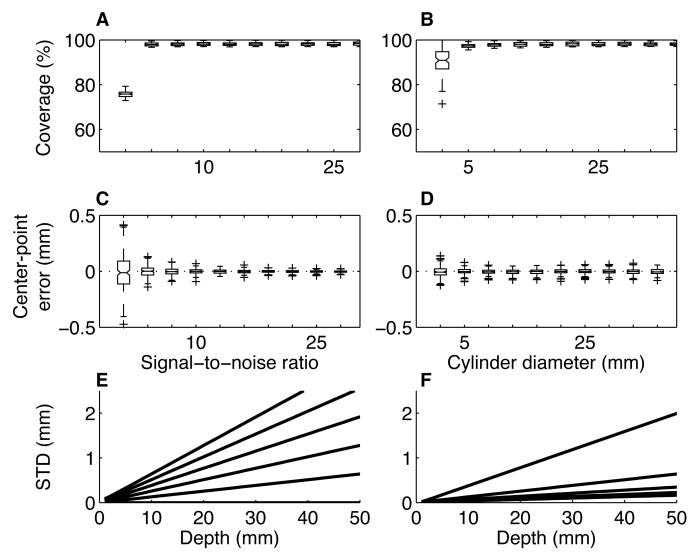
Figure 4.
Estimates of error. All errors were stimulated by comparing a high-resolution (0.01 mm isotropic voxels) image of an ellipse of a random aspect ratio (between 1 and 2.5) and orientation (between 0 and 180°) to a sampled, corrupted version of the same ellipse (0.7 mm isotropic voxels; n=100 iterations per condition). A. Box-and-whisker plot (center lines are medians; boxes are interquartile ranges; lines extend to the most extreme values within 1.5 times the interquartile range; crosses are outliers) of coverage (percent of the high-resolution image covered by the sampled image) as a function of the signal-to-noise ratio (SNR) of the sampled image. For these simulations, cylinder diameter=20 mm. B. Box-and-whisker plot of coverage as a function of cylinder diameter; SNR=20. C. Error in the estimate of the center point of the high-resolution ellipse in one dimension (estimated using the sampled image) as a function of SNR; cylinder diameter=20 mm. D. Error in the estimate of the center point of the high-resolution ellipse in one dimension as a function of cylinder diameter; SNR=20. E. Standard deviation of the estimated location of the long axis of the cylinder corresponding to the high-resolution ellipses as a function of depth from the sampled ellipses. Lines correspond to different standard deviations in the estimates of the centers of the sampled ellipses (bottom-to-top are 0 to 0.1 mm in increments of 0.02). F. Standard deviation of the estimated location of the long axis of the high-resolution cylinder as a function of depth from the sampled ellipses. Lines correspond to different numbers of sampled ellipses (bottom-to-top are 2 to 10 in increments of 2). In E and F, errors in the estimates of the centers of the sampled ellipses increase with increasing depth.

