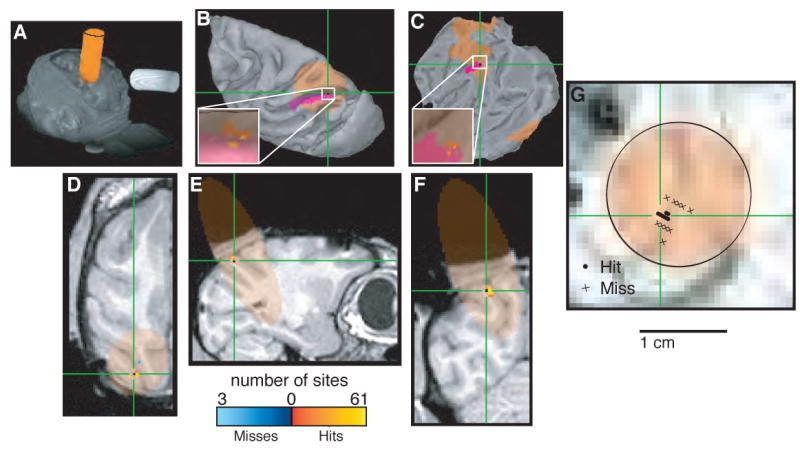
Figure 6.

Localizing area LIP. In each panel, orange indicates cylinder coverage (diameter = 1.65 cm), green crosshairs and purple spots in B and C indicate the predicted location of LIP determined by registering the images to a publicly available atlas (Lewis and Van Essen, 2000; Van Essen and Dierker, 2007) and color codes shown at bottom indicate the number of recording sites at a given location classified as a “hit” or “miss” of LIP based on physiological properties, including spatially selective visual, delay and oculomotor responses (Gnadt and Andersen, 1988; Colby et al., 1996). A. Volume render showing external surfaces of the head and recording chamber. B. Surface reconstruction of the left cortical hemisphere. C. Flat map of the left cortical hemisphere. D. Horizontal section. E. Sagittal section. F. Coronal section. G. Section taken perpendicular to the long axis of the recording chamber at a depth corresponding to the location of LIP. Circles indicate penetrations that included at least one recording site that was classified as LIP based on physiological properties; crosses indicate penetrations with no sites that were classified as LIP. B and C were generated using Caret (Van Essen et al., 2001). A and D–G were generated using AFNI (Cox, 1996).
