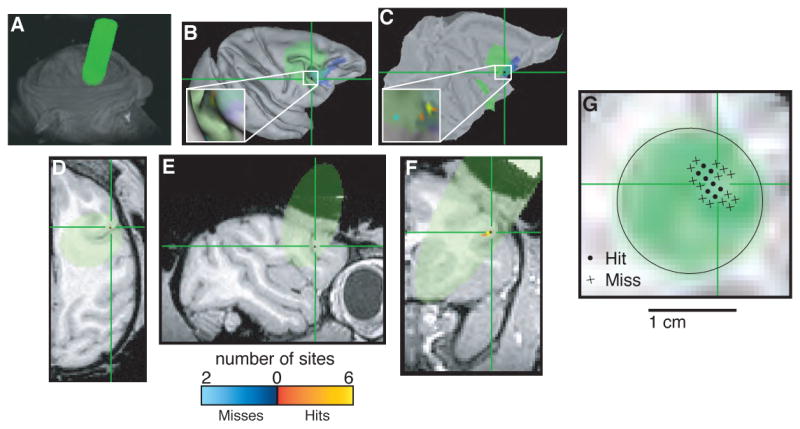
Figure 7.

Localizing area FEF. In each panel, green indicates cylinder coverage (diameter = 1.65 cm), green crosshairs and blue spots in B and C indicate the predicted location of FEF determined by registering the images to a publicly available atlas (Lewis and Van Essen, 2000; Van Essen and Dierker, 2007) and color codes shown at bottom indicate the number of recording sites at a given location classified as a “hit” or “miss” of FEF based on physiological properties, including the ability to evoke saccadic eye movements with electrical microstimulation using <50 μA of current (Bruce et al., 1985). A. Volume render showing external surfaces of the head and recording chamber. B. Surface reconstruction of the right cortical hemisphere. C. Flat map of the right cortical hemisphere. D. Horizontal section. E. Sagittal section. F. Coronal section. G. Section taken perpendicular to the long axis of the recording chamber at a depth corresponding to the location of the FEF. Circles indicate penetrations that included at least one recording site that was classified as FEF based on physiological properties; crosses indicate penetrations with no sites that were classified as FEF. B and C were generated using Caret (Van Essen et al., 2001). A and D–G were generated using AFNI (Cox, 1996).
