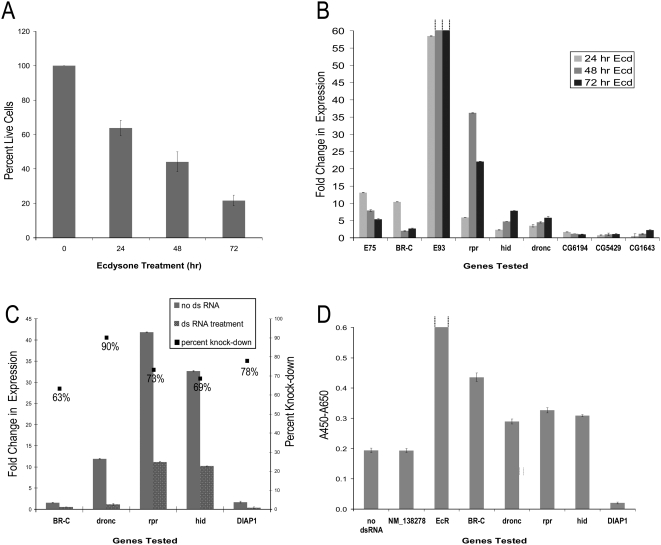
Figure 1. Ecdysone signaling and apoptosis genes are differentially expressed and required for cell death in ecdysone treated l(2)mbn cells.
(A) l(2)mbn cells treated with 10 µM ecdysone showed a >70% reduction in live cells after 72 hours. Cells were exposed to 10 µM ecdysone for the times indicated. Surviving cells were counted by Trypan blue exclusion and percent live cells were calculated by comparing ecdysone-treated cells with untreated cells (100%). (B) QRT-PCR expression profiling showed that the ecdysone induced genes E75, BR-C, E93, rpr, hid and dronc had elevated levels of expression (at least 4 fold increase) in ecdysone treated (10 µM) l(2)mbn cells relative to untreated control l(2)mbn cells. The dotted lines above the bars for E93 indicate that the fold change in expression exceeded the existing scale (48 hrs, 126 fold change; 72 hrs, 371 fold change). The autophagy genes, DmAtg4-like (CG6194), DmAtg6(CG5429), and DmAtg5(CG1643), did not show differential expression following ecdysone treatment. (C) QRT-PCR analysis of gene transcripts following treatment with the indicated dsRNAs and ecdysone. As shown here, the knockdown ranged between 63% and 90% for the representative gene transcripts tested following 72 hr dsRNA and ecdysone treatment compared to ecdysone treatment alone. (D) Cells treated with dsRNA corresponding to BR-C, EcR, dronc, rpr, and hid showed significantly (p≤0.05) increased levels of cell viability and those treated with dsRNA corresponding to diap-1 showed significantly (p≤0.05) reduced levels of cell viability compared to cells treated with ecdysone and human dsRNA NM_138278 (negative control). Cell viability was measured by the WST-1 assay (A450–A650). The dotted lines above the bar for EcR indicate the A450–A650 value ( = 1.0) exceeded the existing scale. For (A)–(D), the error bars represent the SD of triplicate samples.

